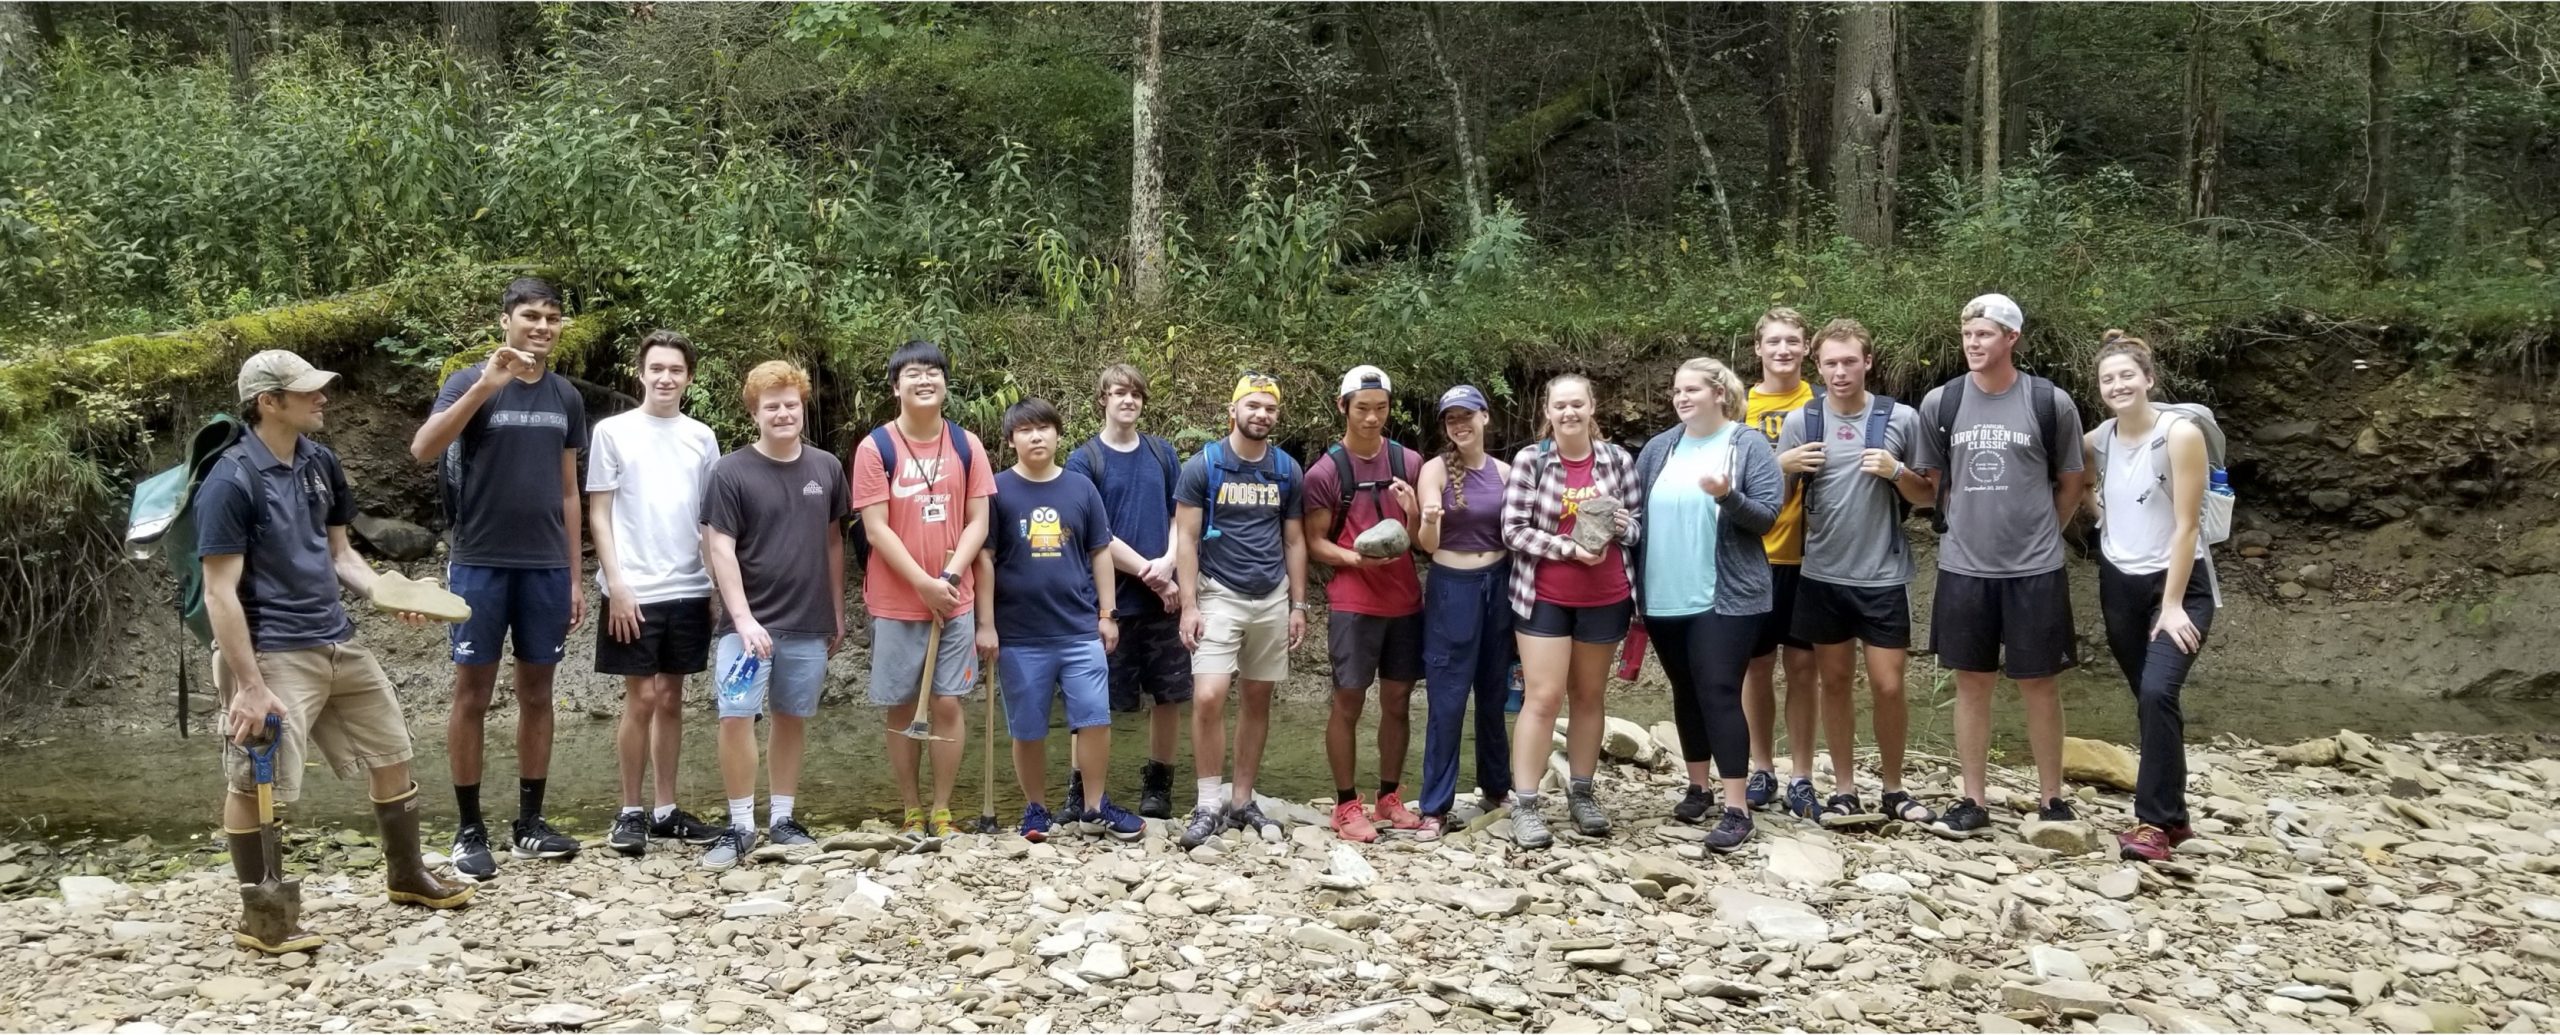
 We were all there that day in September at Spangler when we saw the evidence of the ice age – the loess the Pleistocene/Holocene unconformity. A special shout out to Nick (far left) who provided the logistics for these trips and labs and made it work.
 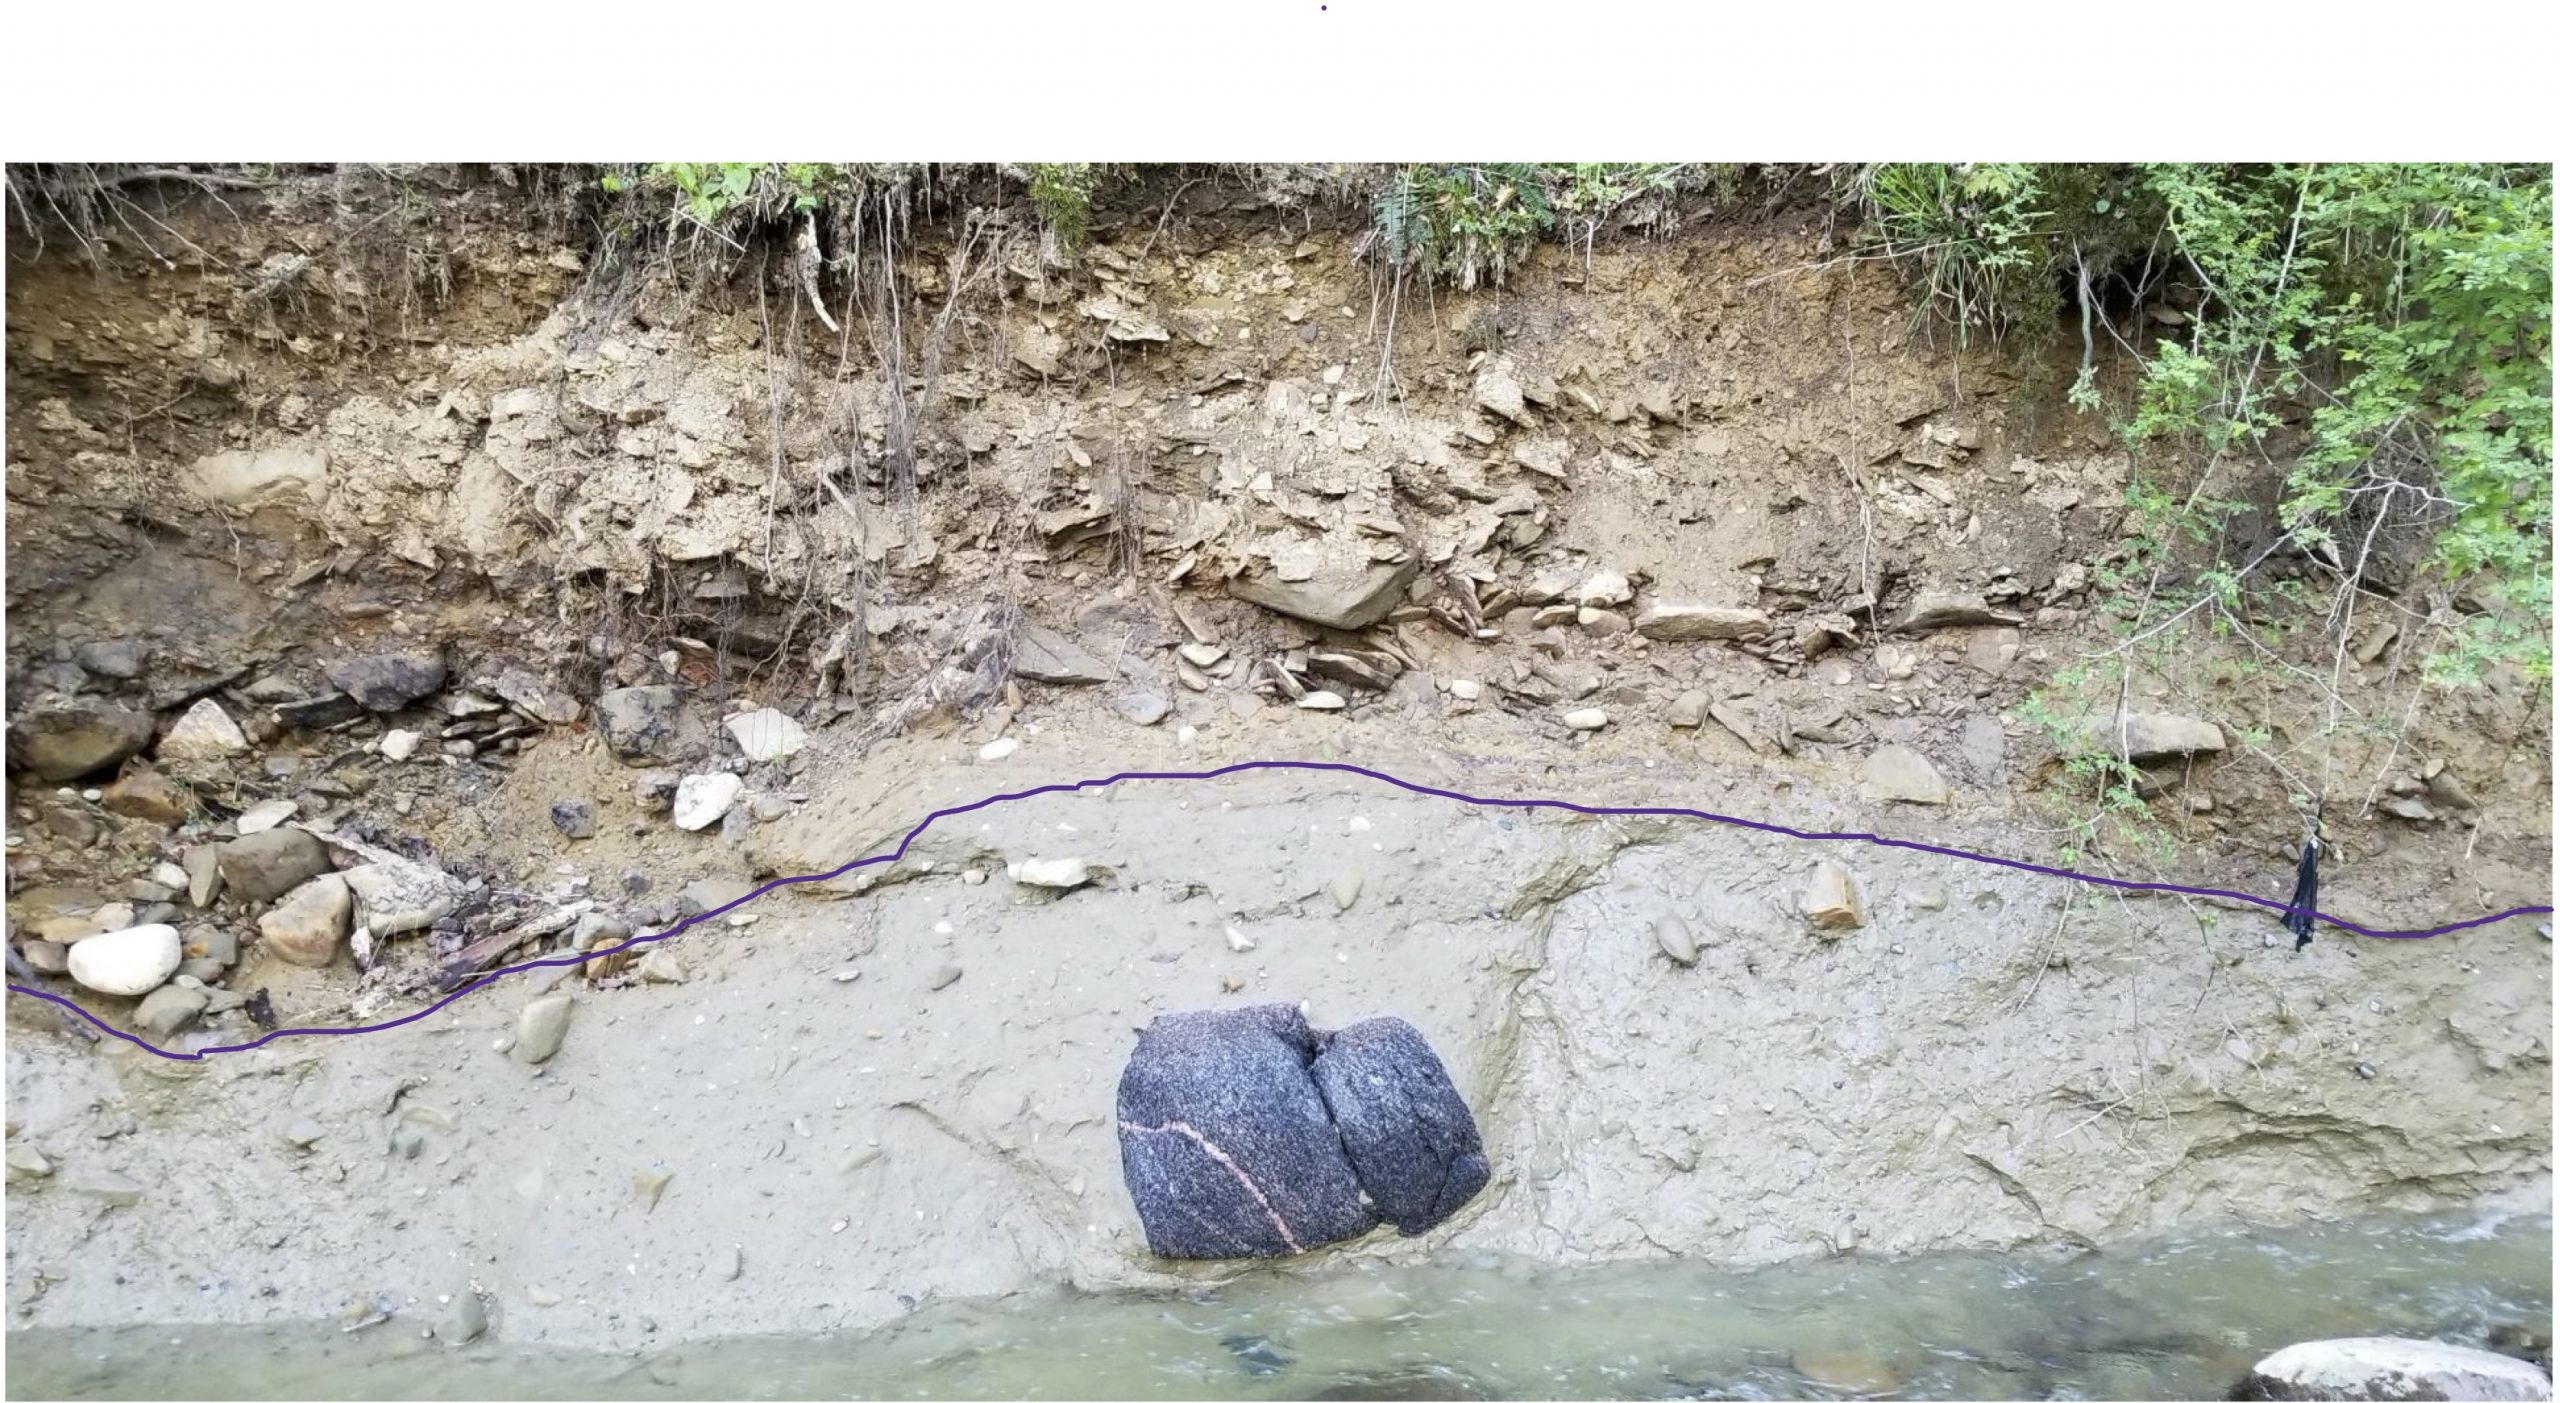 The unconformity – the glacial till below with an gneiss/schist erratic, the Pleistocene below and the Holocene above the line.
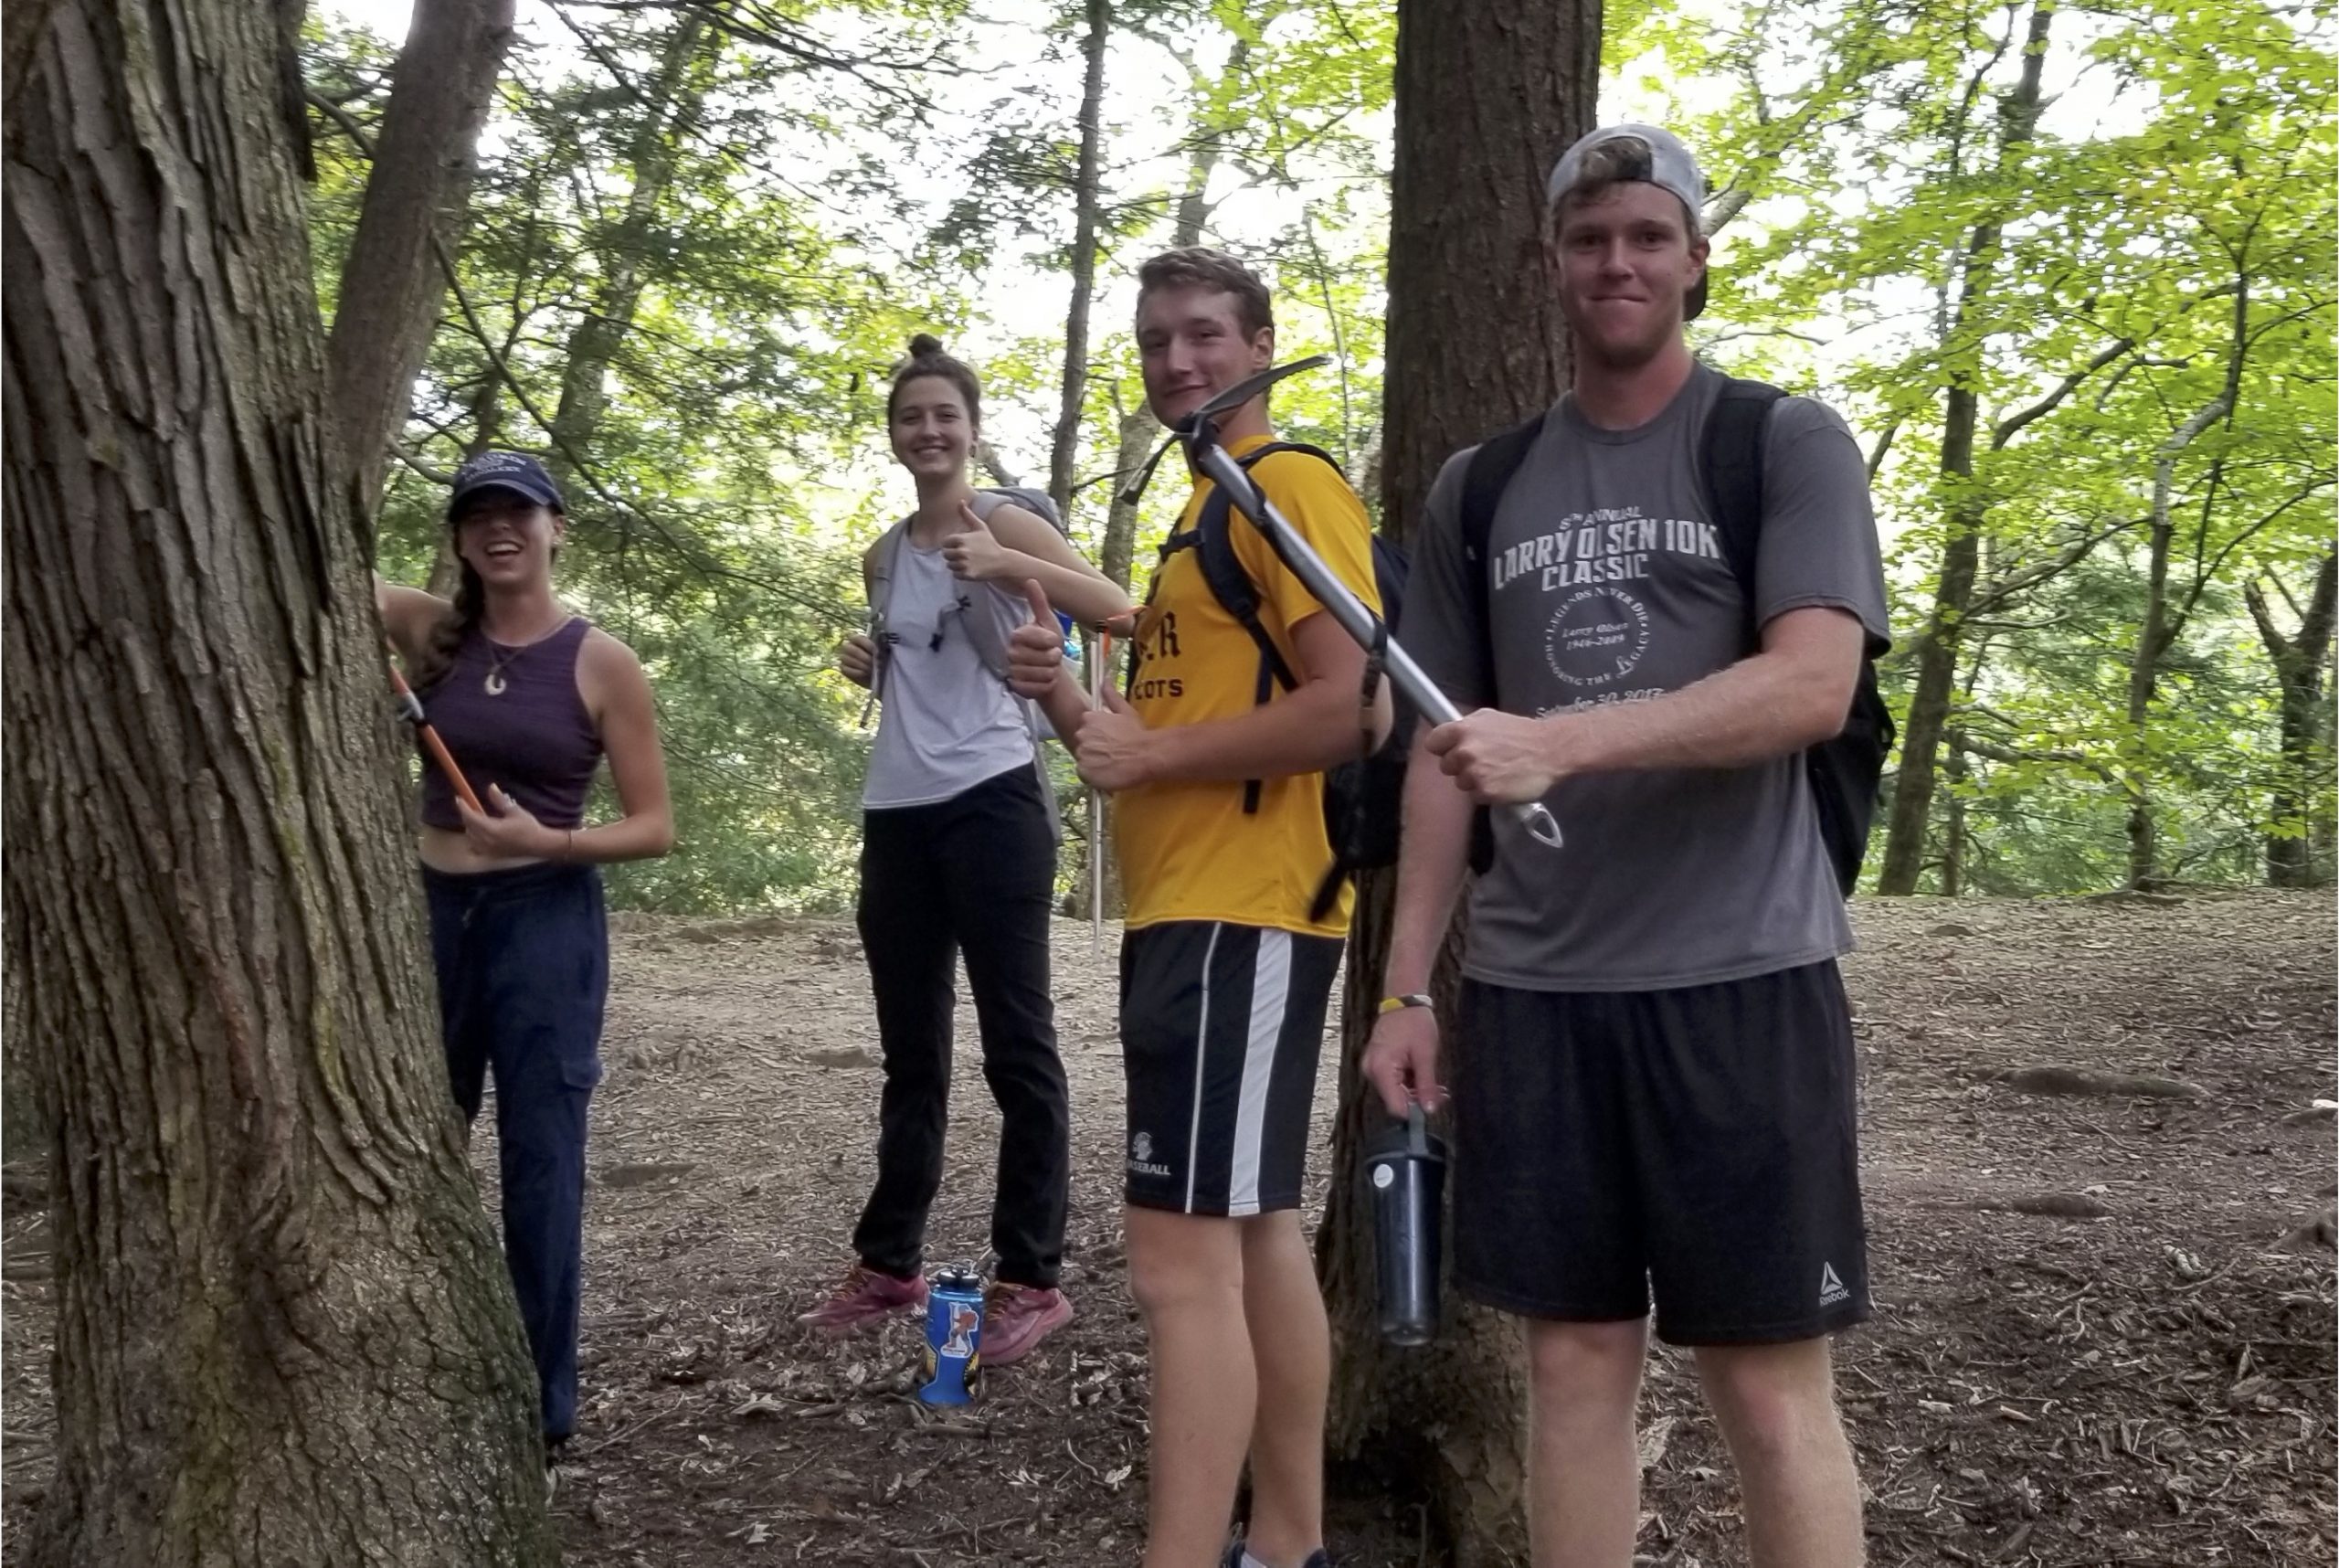
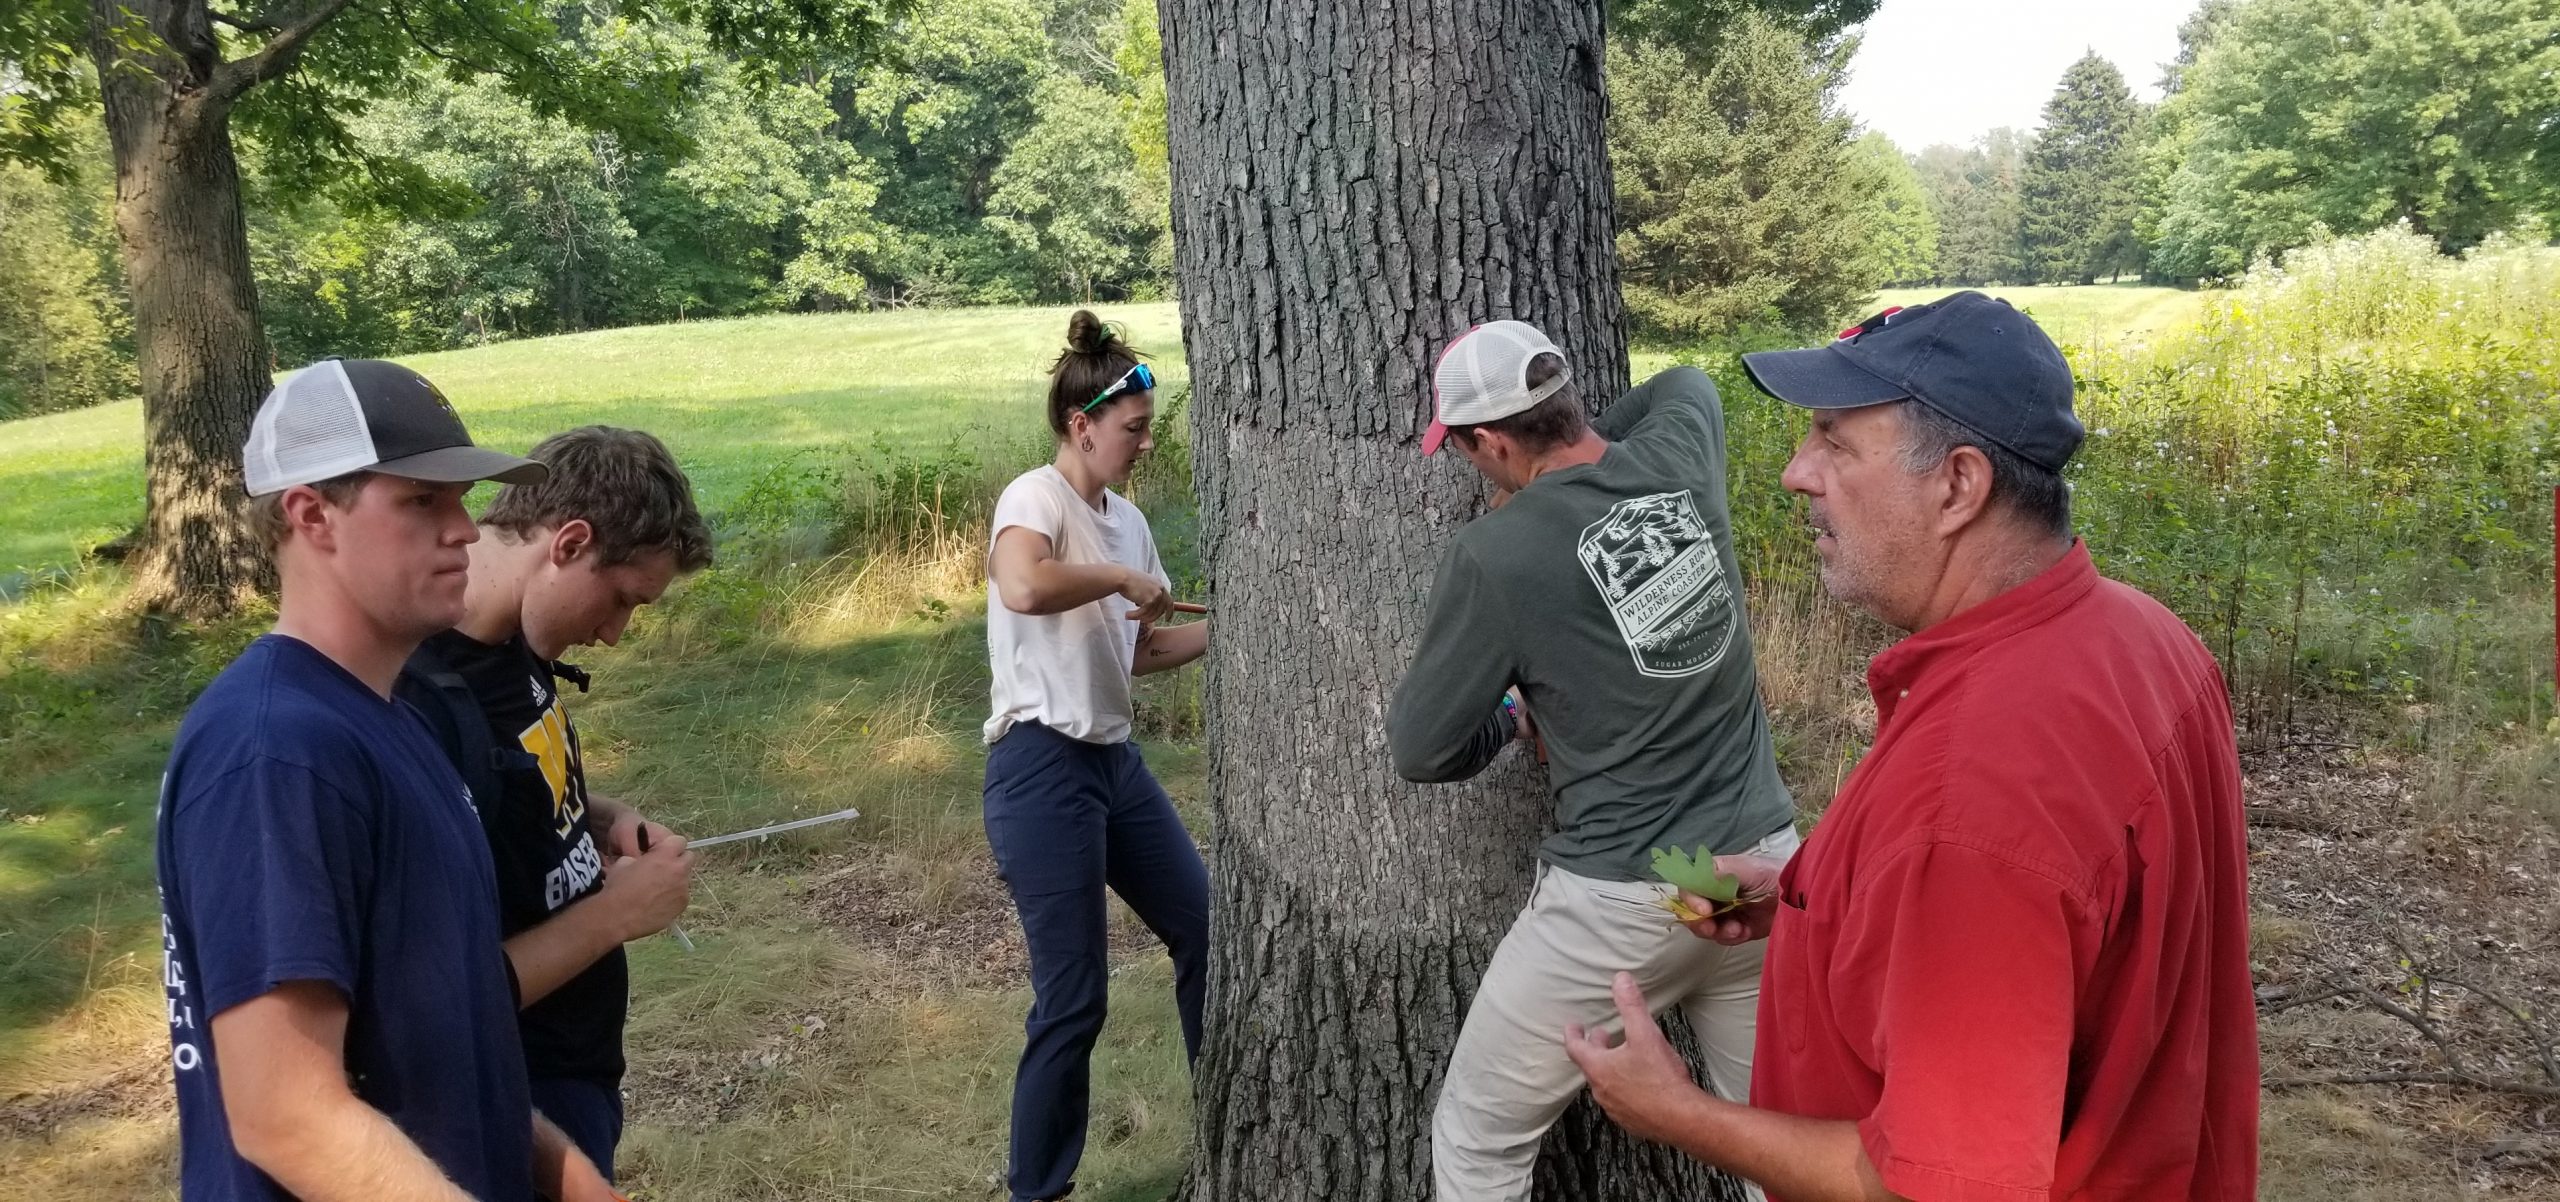
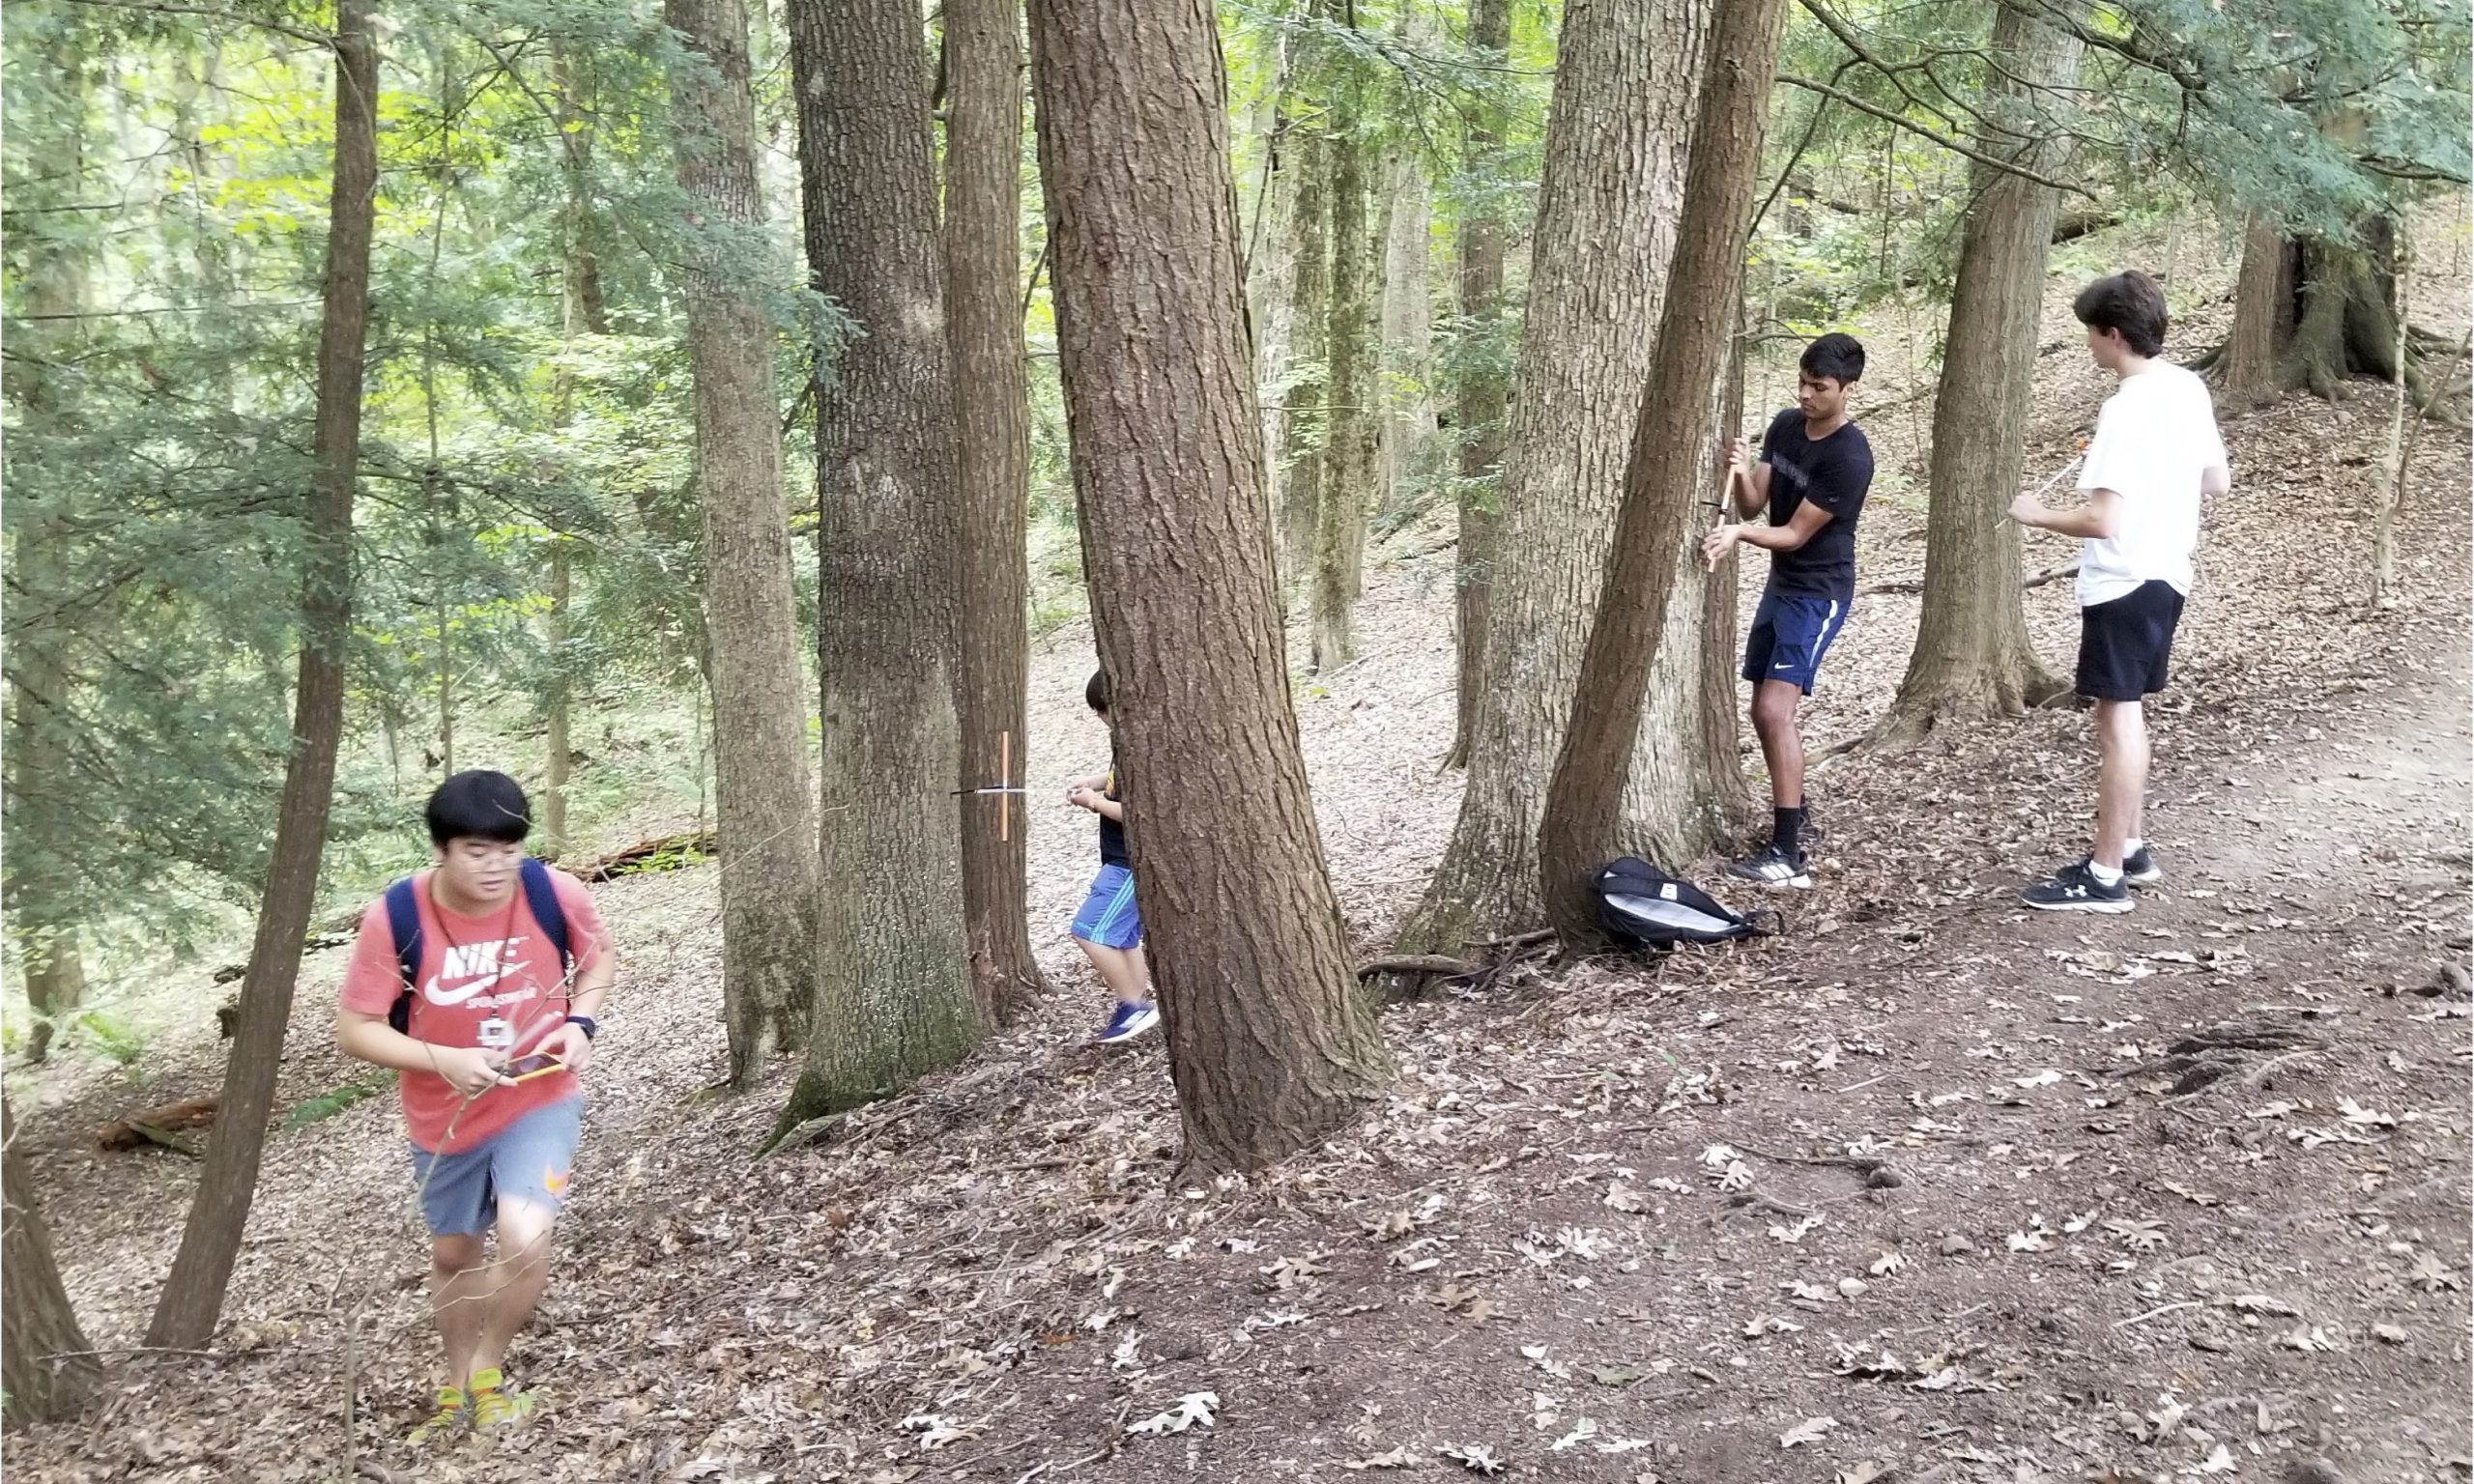 Nick took us to some oaks that although second growth were old – here an international team of experts takes some cores.
 More cores were taken.
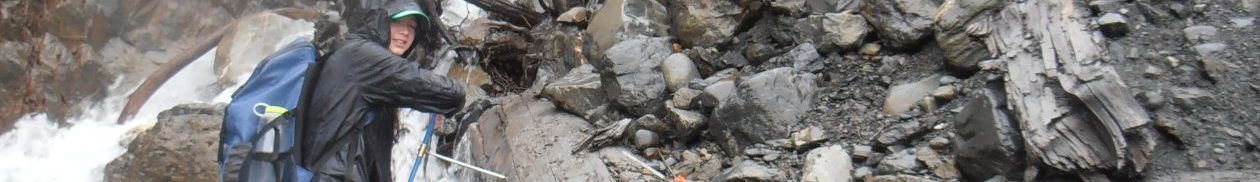
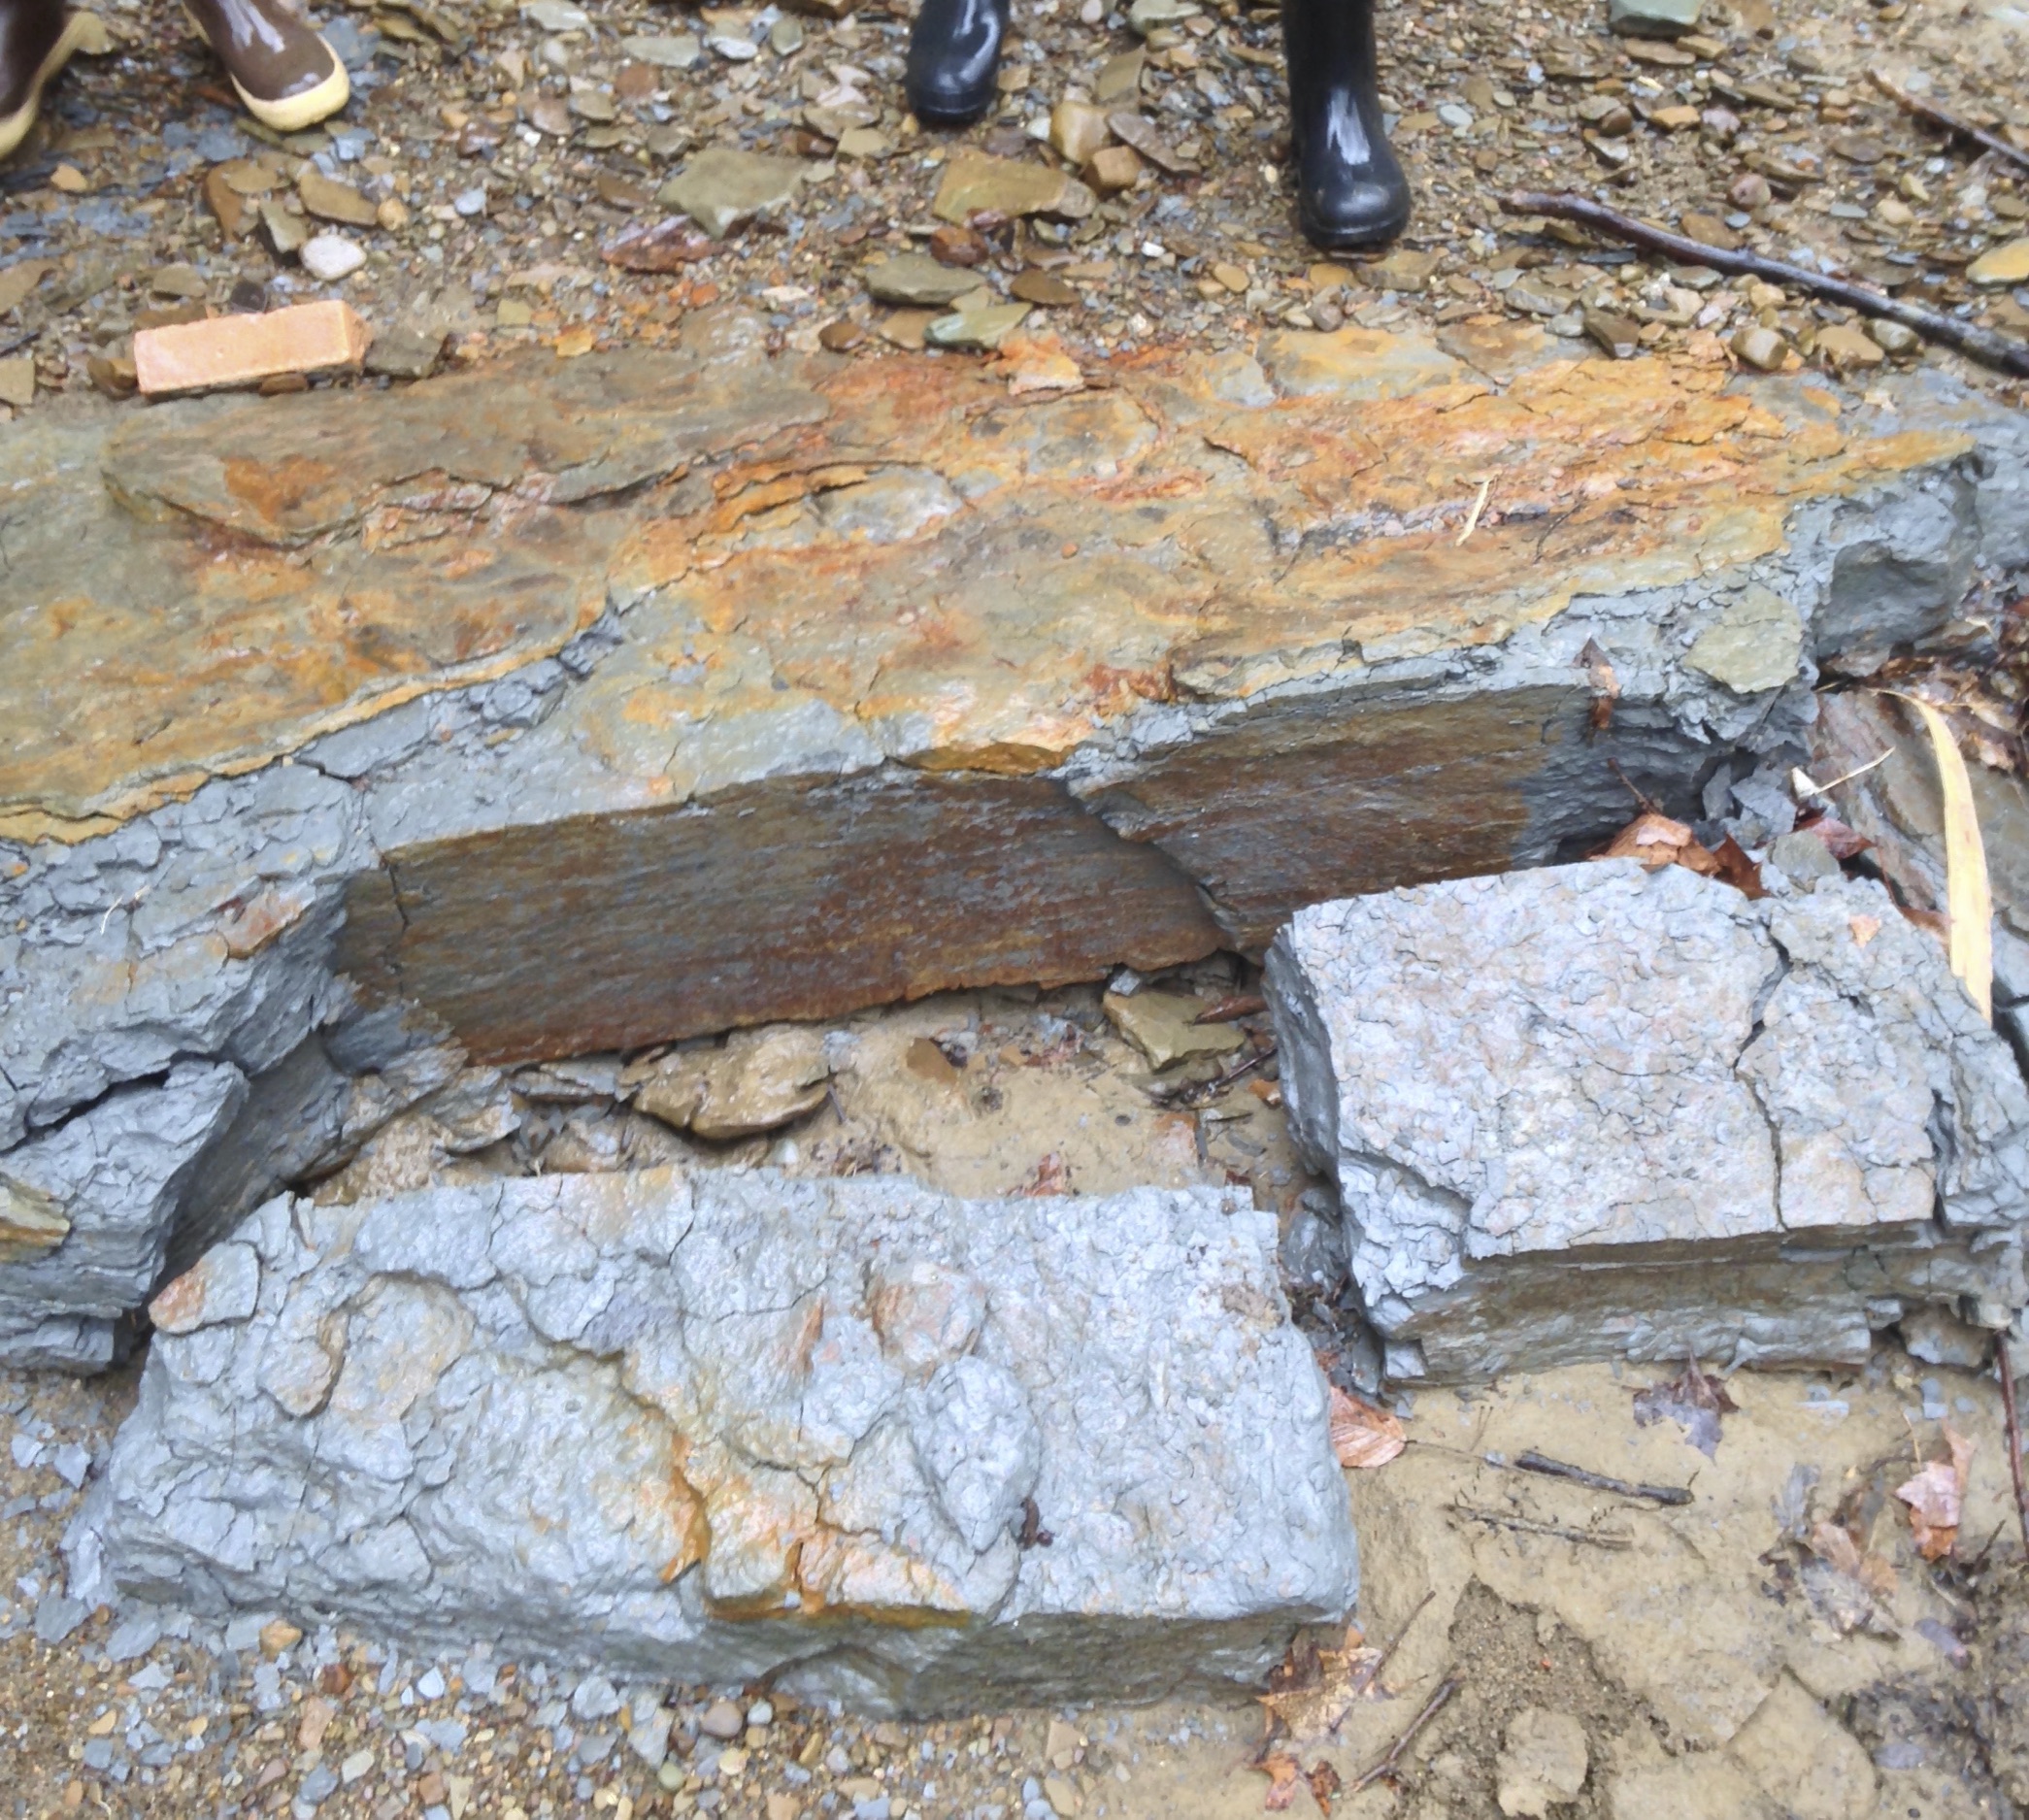 This shale block ripped up by a late summer flood is ephemeral – now three months after the trip this block will be barely recognizable. The ongoing pluvial is ripping apart geology that is over 200 million years old and it is not stopping, it is ramping up and driving our science. Climate change and stormwater management are two fields of Earth Sciences where we need the folks in these photos to understand and help mitigate the societal impacts of these challenges.
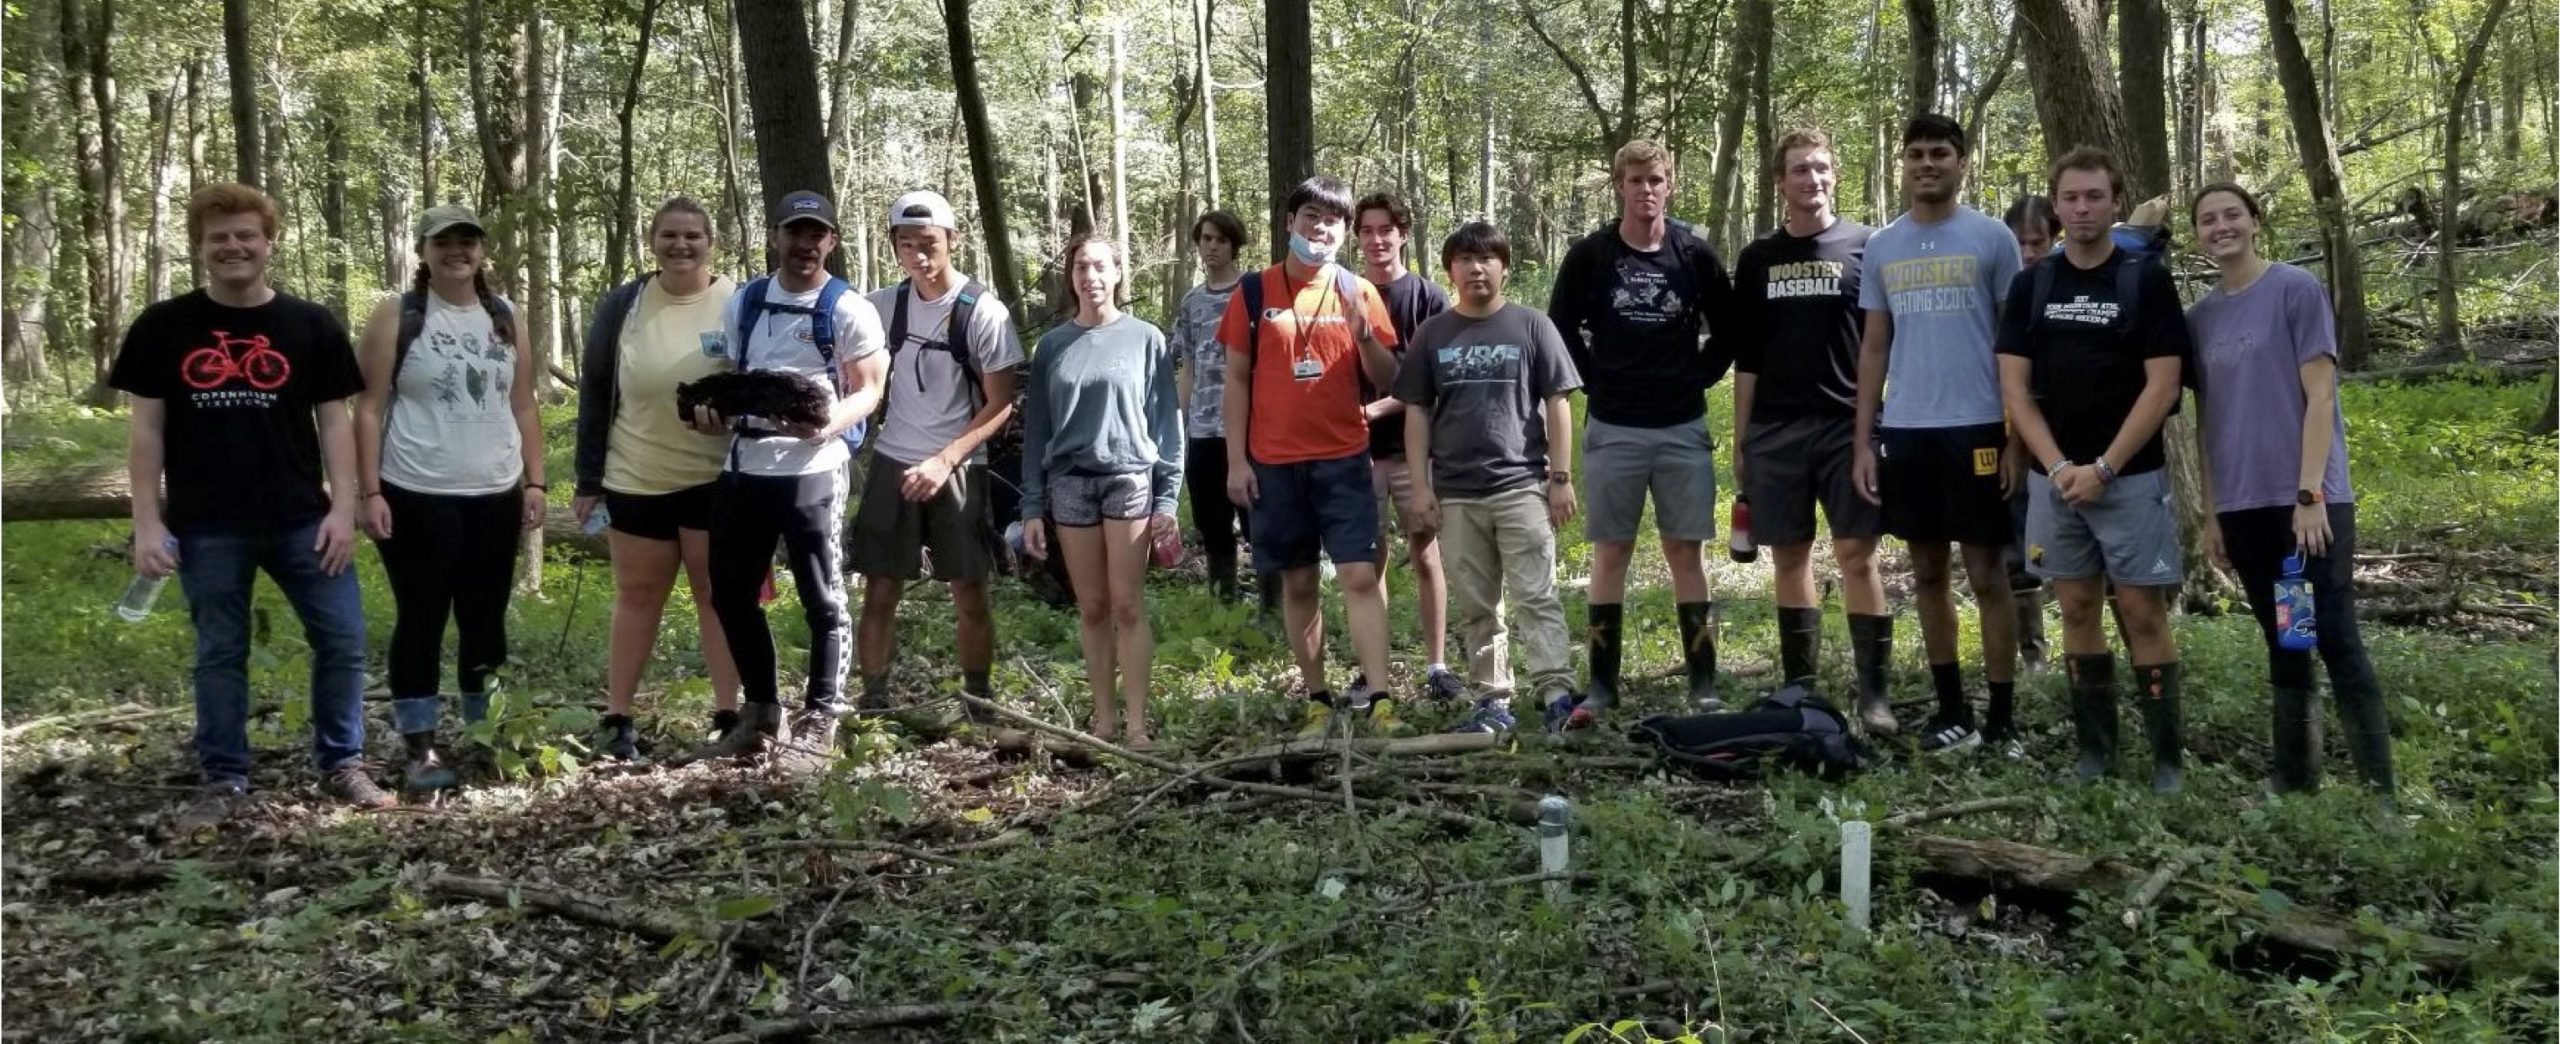 We were almost all there that day in September at Browns Lake when we laid down the basics for bog coring later in the semester.
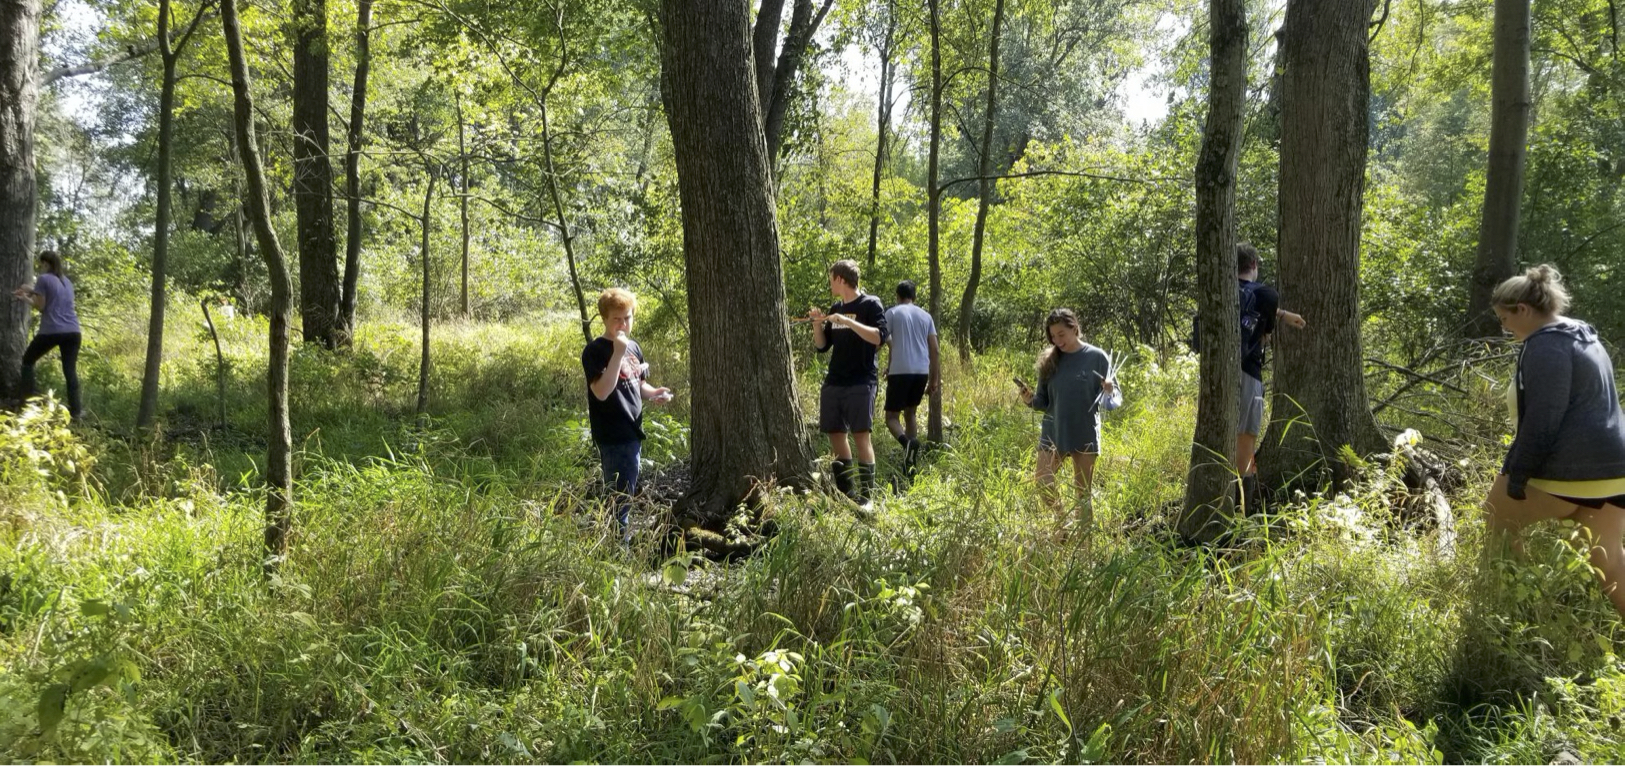 Coring on the flat – the margin of the bog, determining the age of the first arrival of trees into the peat land.
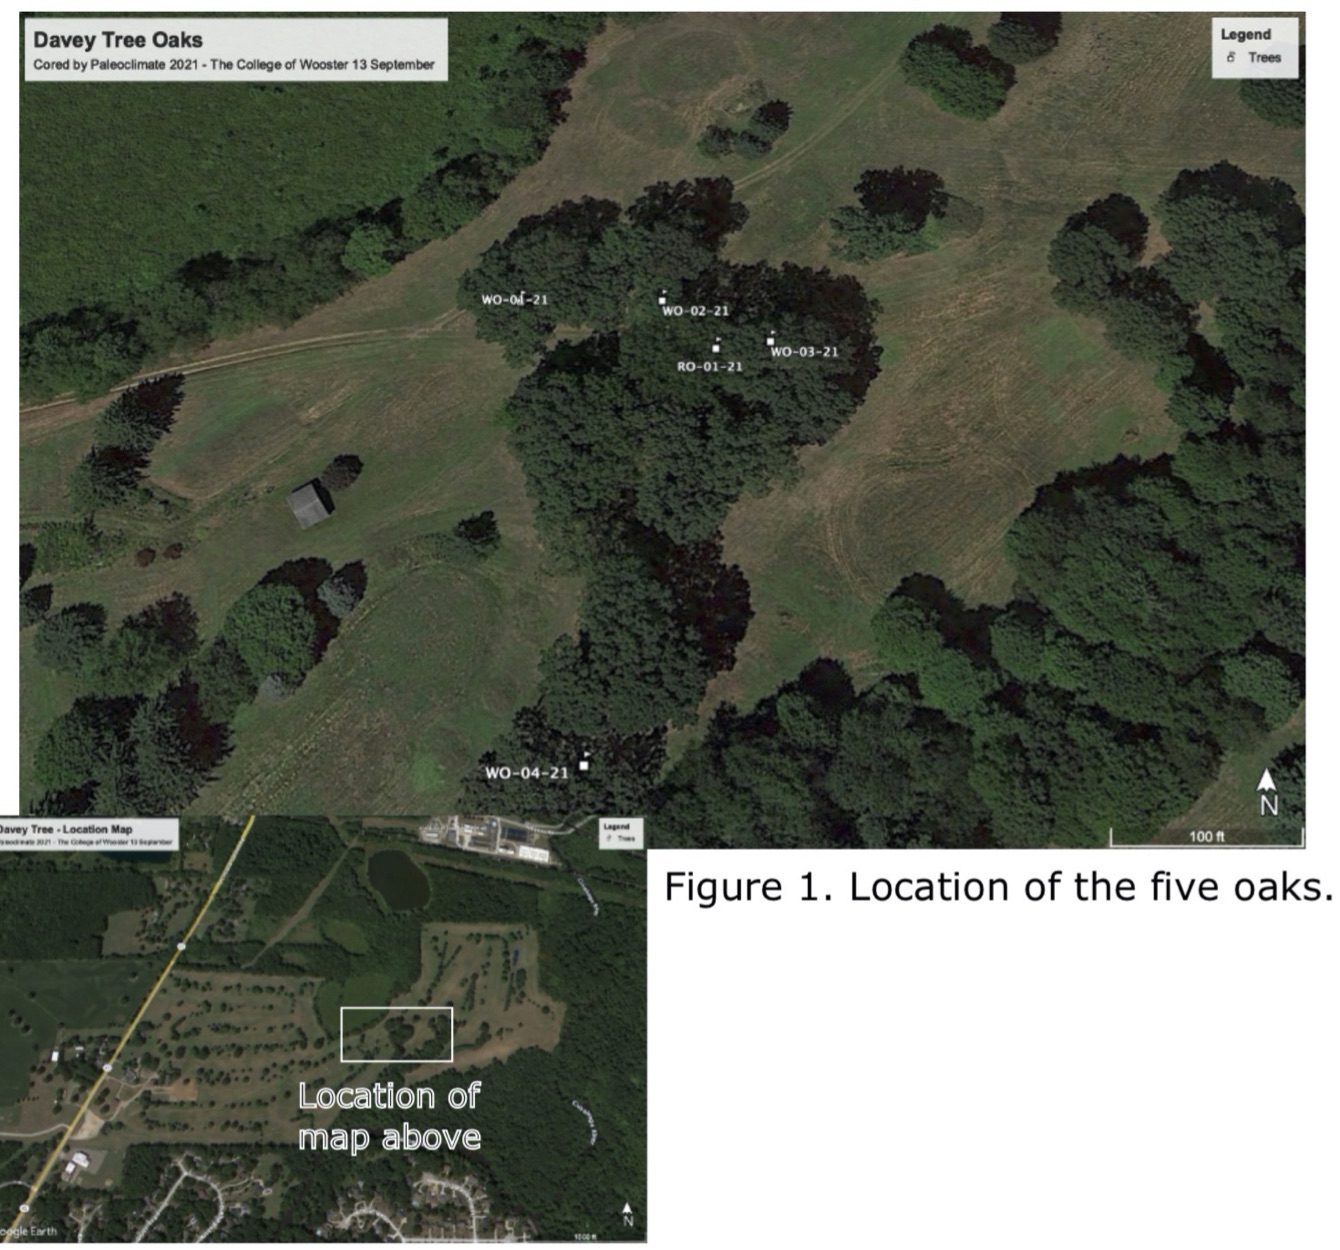
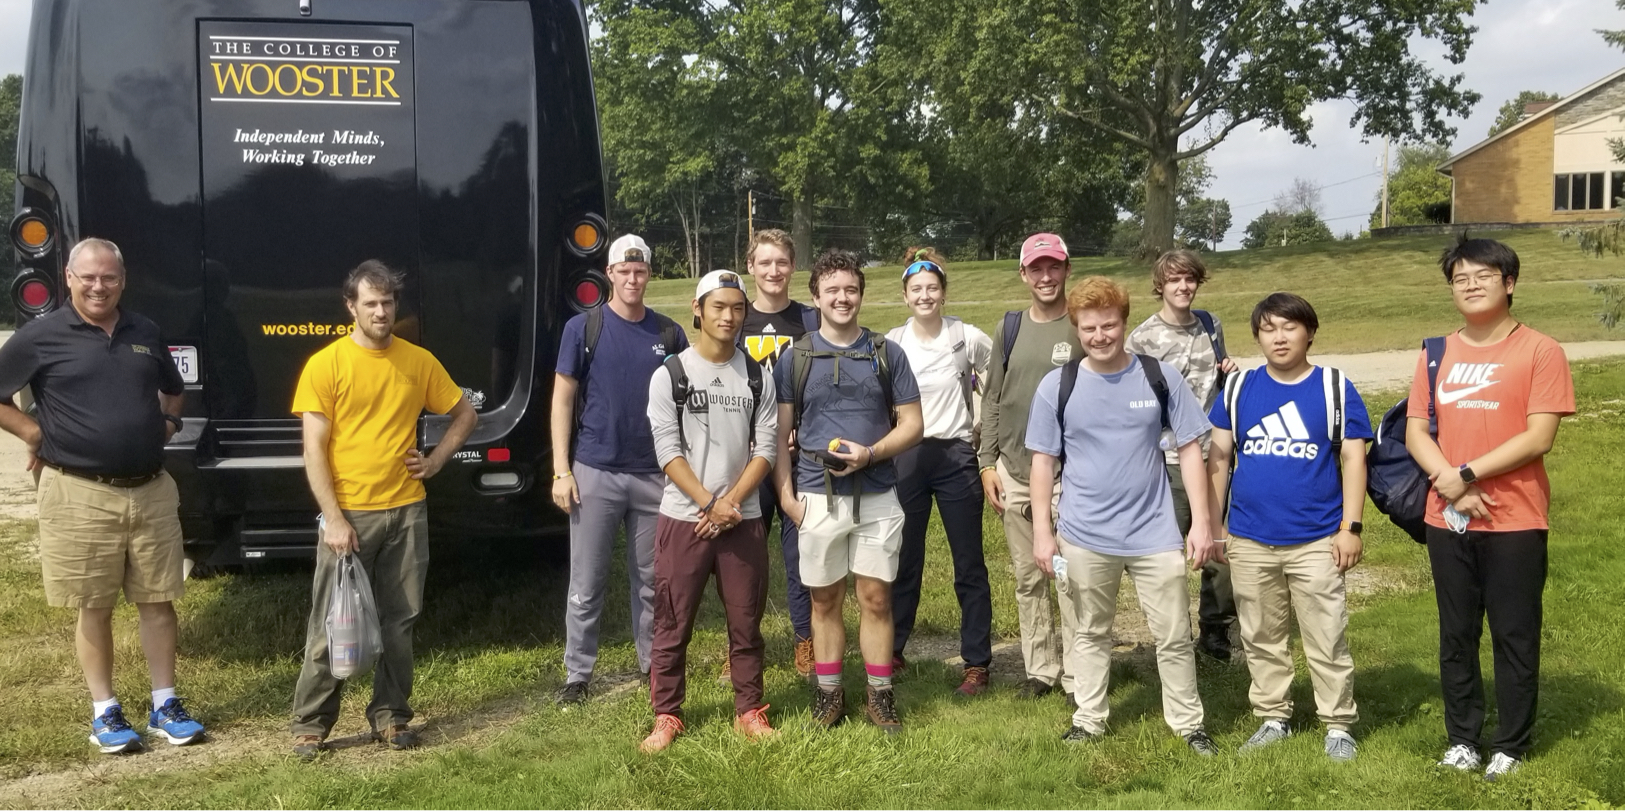 Working at the new Davey Expert Tree Company facility in Kent Ohio – we had two missions: (1) to date the barn at the site soon to be reconstructed at the golf course that will soon be an arboretum and, (2) to core some of the older oaks on the former golf course.
 This group made short work of the white oaks at the site. Dr. Dan Herms (left) was our host. The site also boasts some great bogs and we will be back to core them – likely this summer. We originally went to core larch trees, but found there were none, luckily the group was flexible.
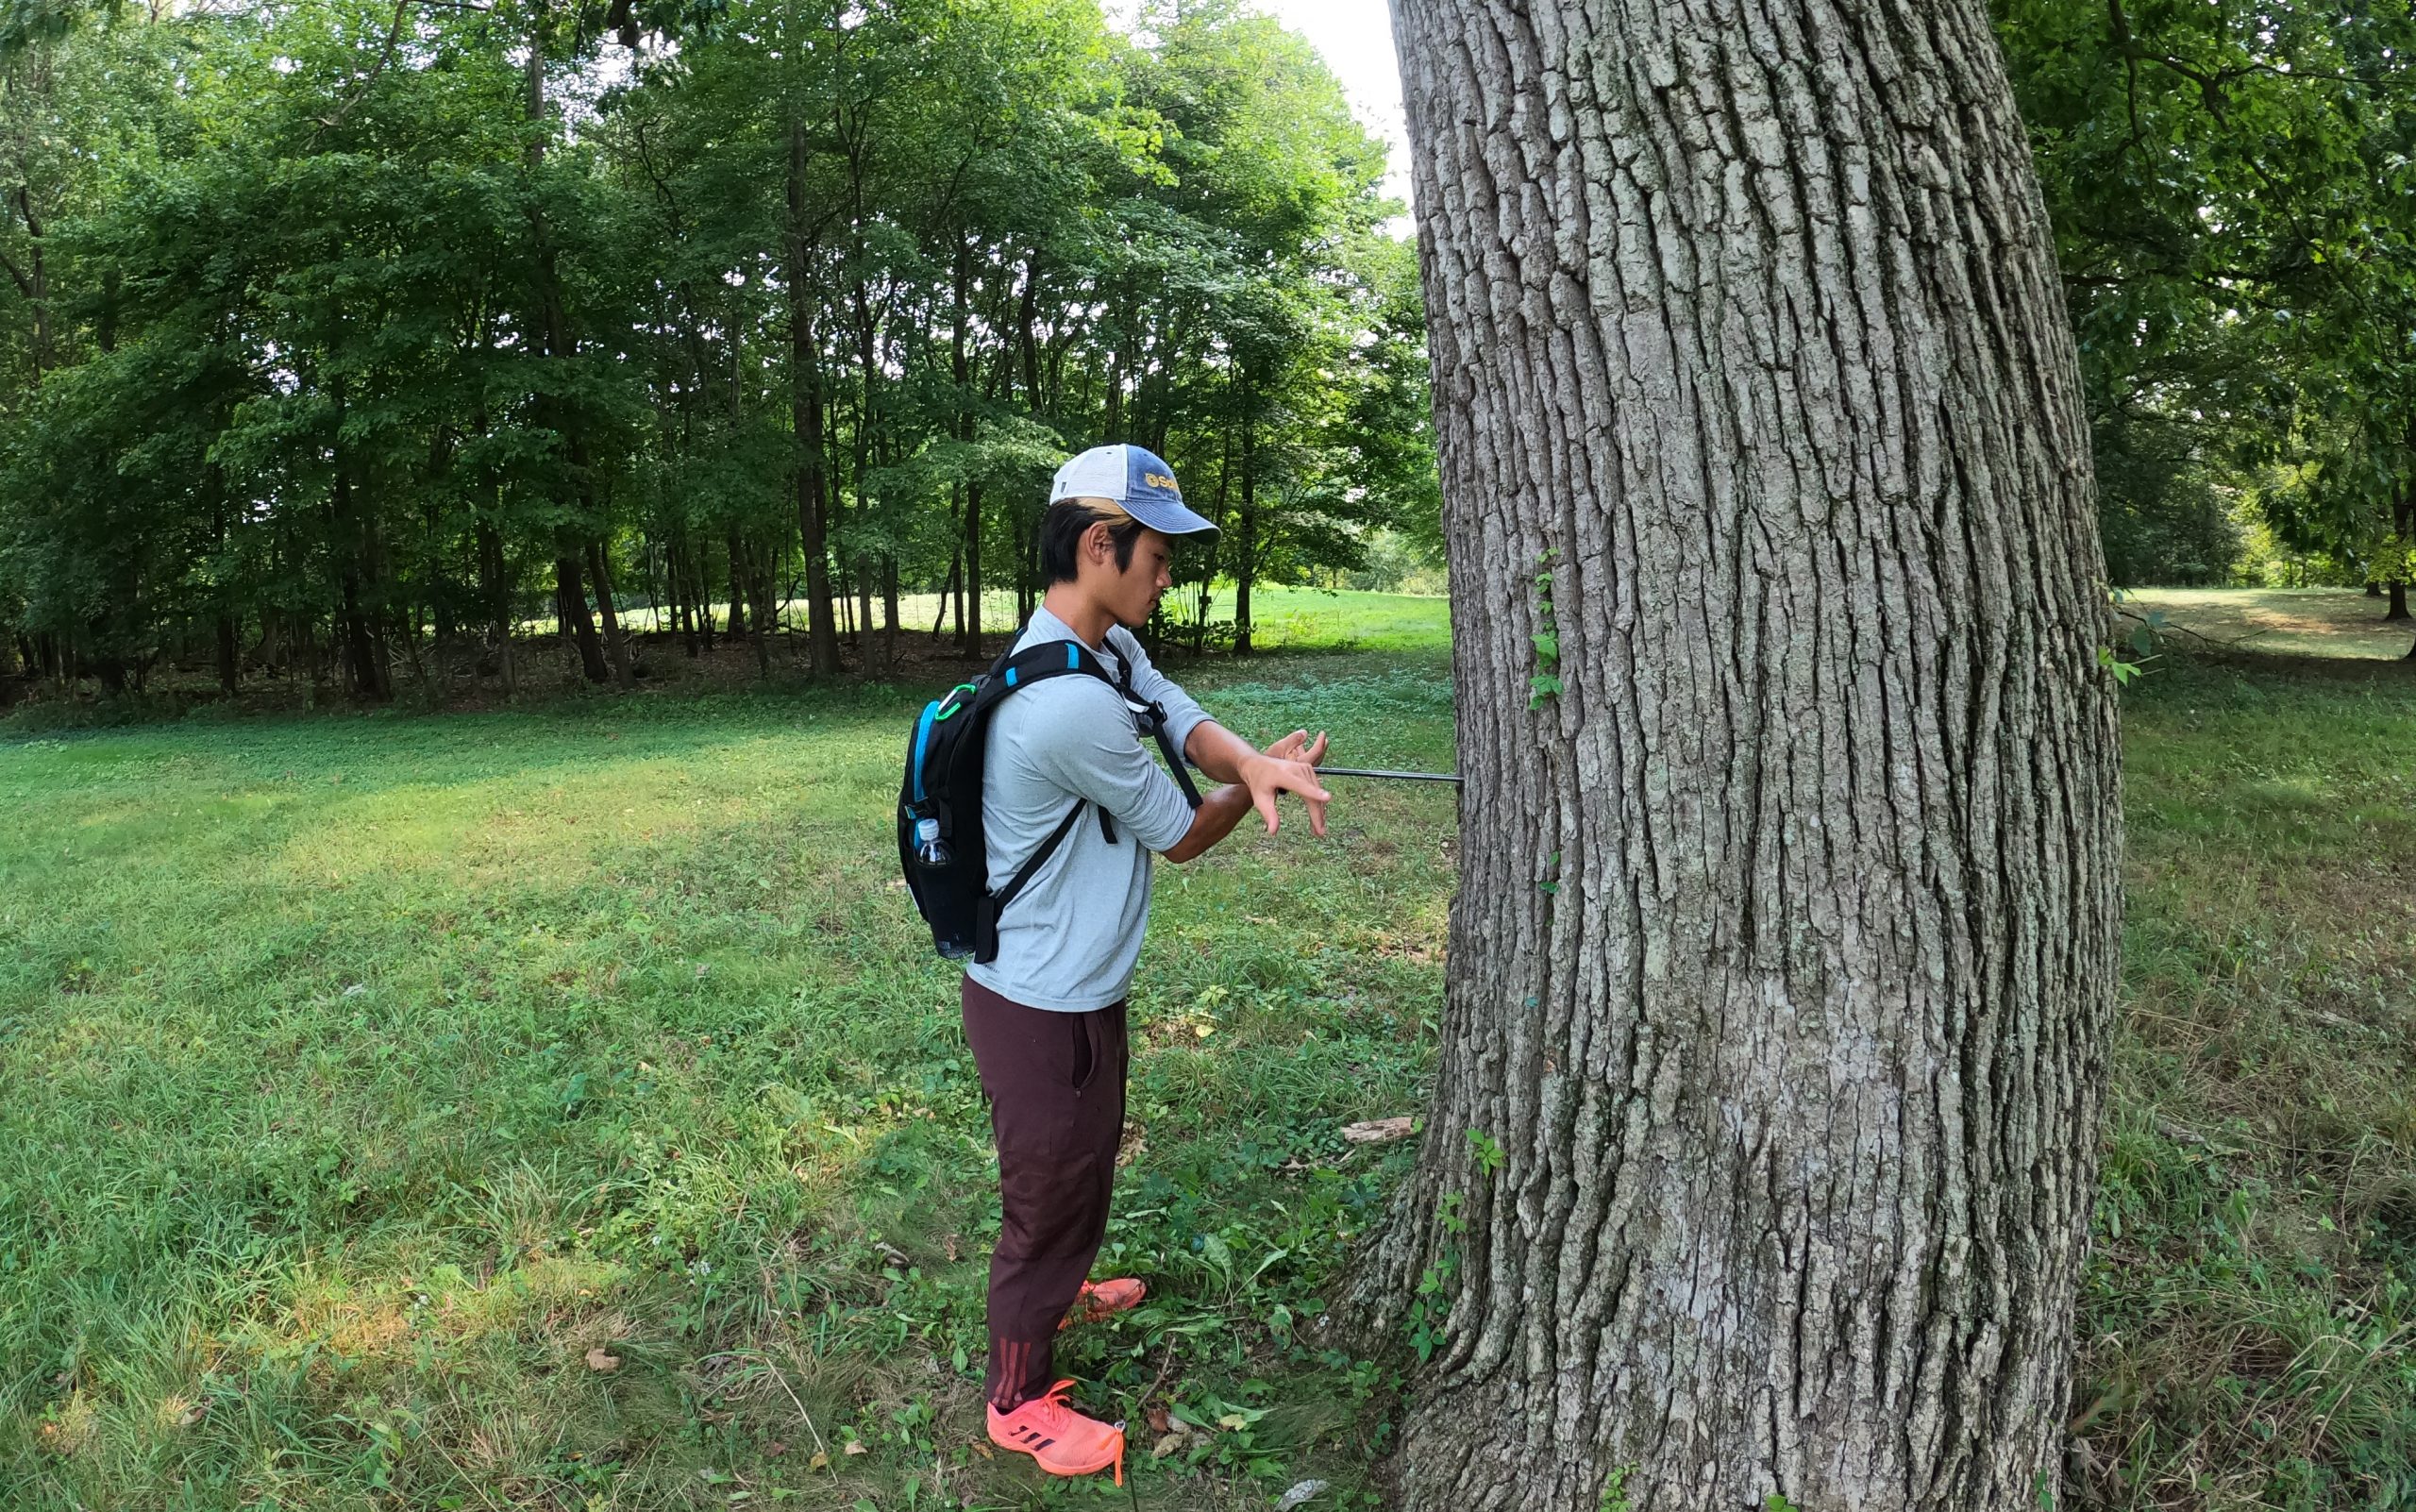 Alex looks like he is deforming this white oak – but his sampling is all non-destructive.
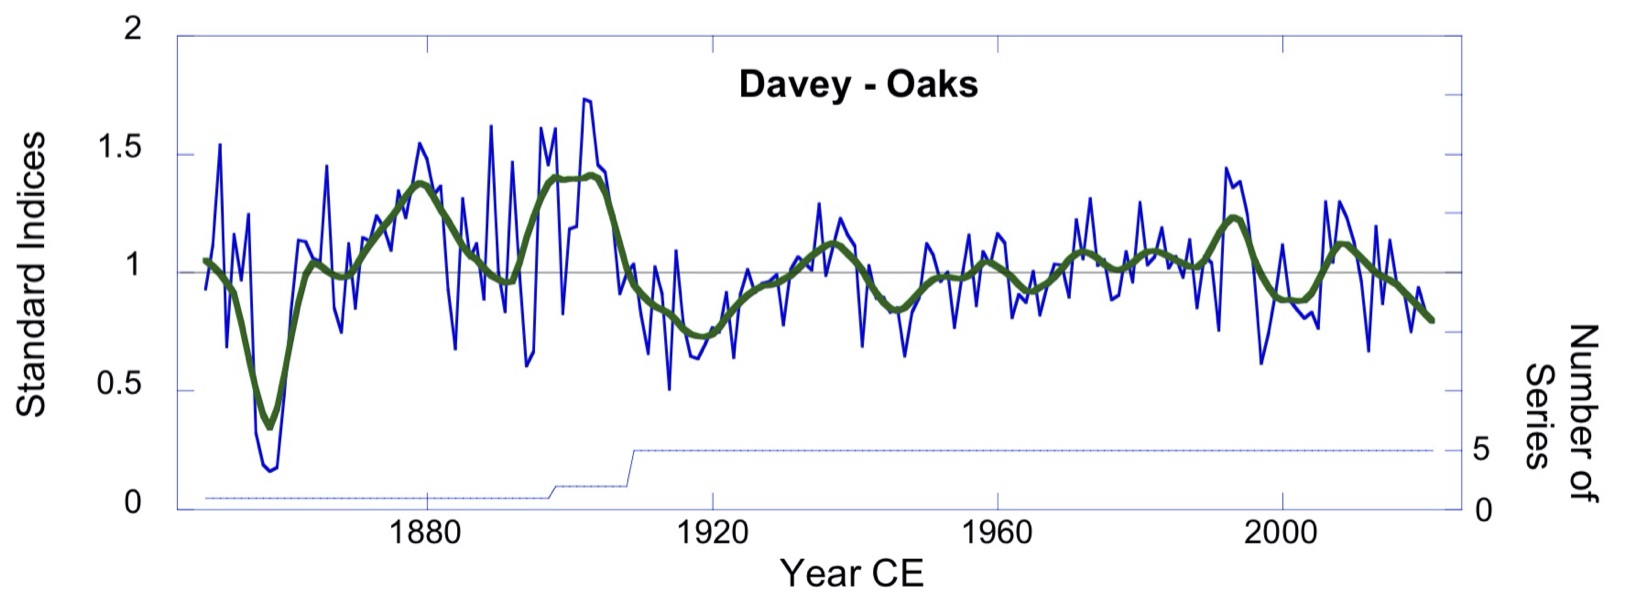 There were only 5 oaks cored, but they did provide a story. It turns out we were able to show that in the 1920s when the site became a golf course the trees lost their sensitivity to moisture due to irrigation.
 The other mission was dating the barn. When we got there the barn (above) had been taken down and stored. The class sampled the beams and did the tree-ring work showing the timber was cut in 1888 and 1889 it was built in 1890.
The report above is what was submitted to the Davey Expert Tree Company. These results we be on display when the visitor’s center to the new arboretum is built in the coming years.
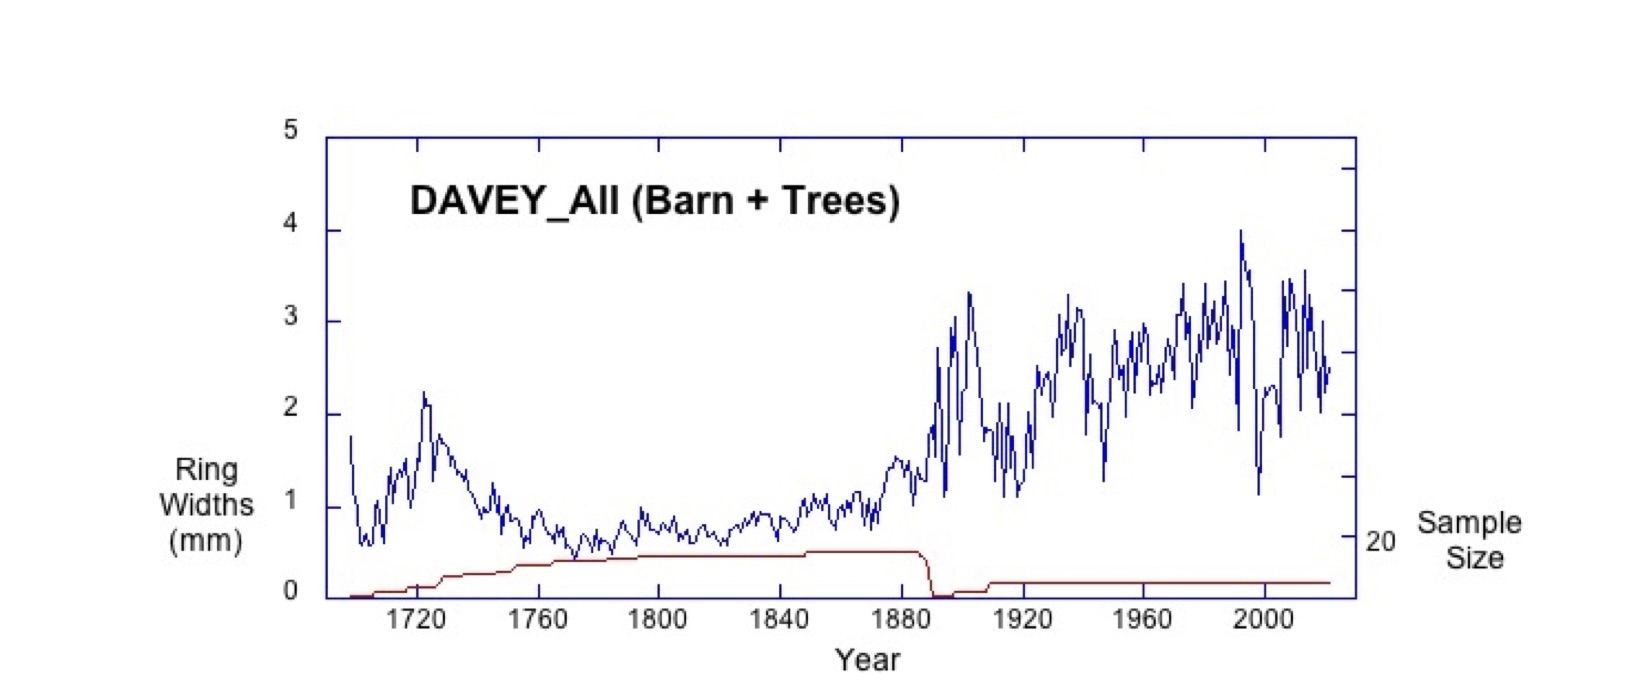 Combining the barn data with the living tree data shows the release in growth of the trees in the late 1800s. This is due to a combination of land use changes, perturbations in biogeochemical cycles and climate (pluvial). The good news is the older trees are sequestering more carbon for us; the sad news is that oaks in Ohio will never again growth as slow and deliberate as the tree growth prior to the 1800s (see below).
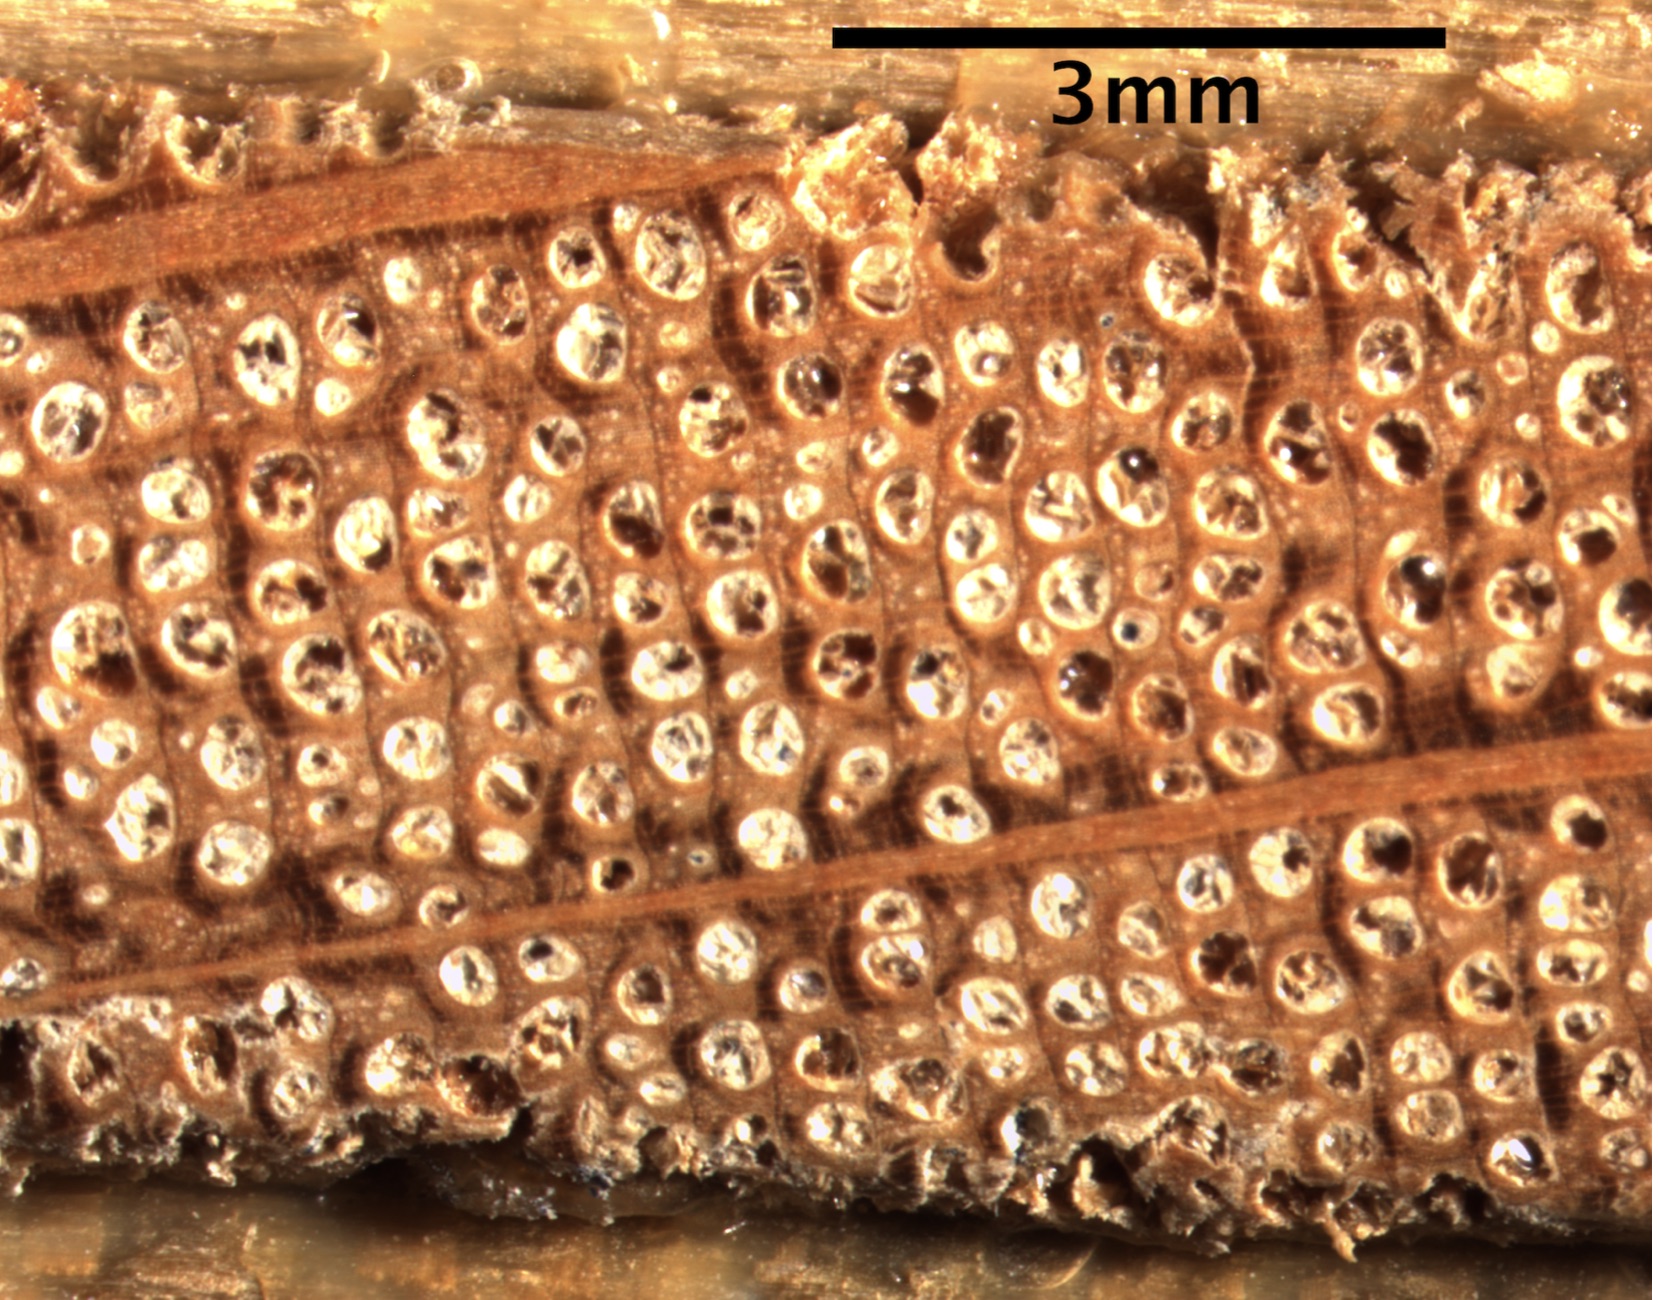 Growth rings from a core from the barn – tree rings dated between 1770 and 1780.
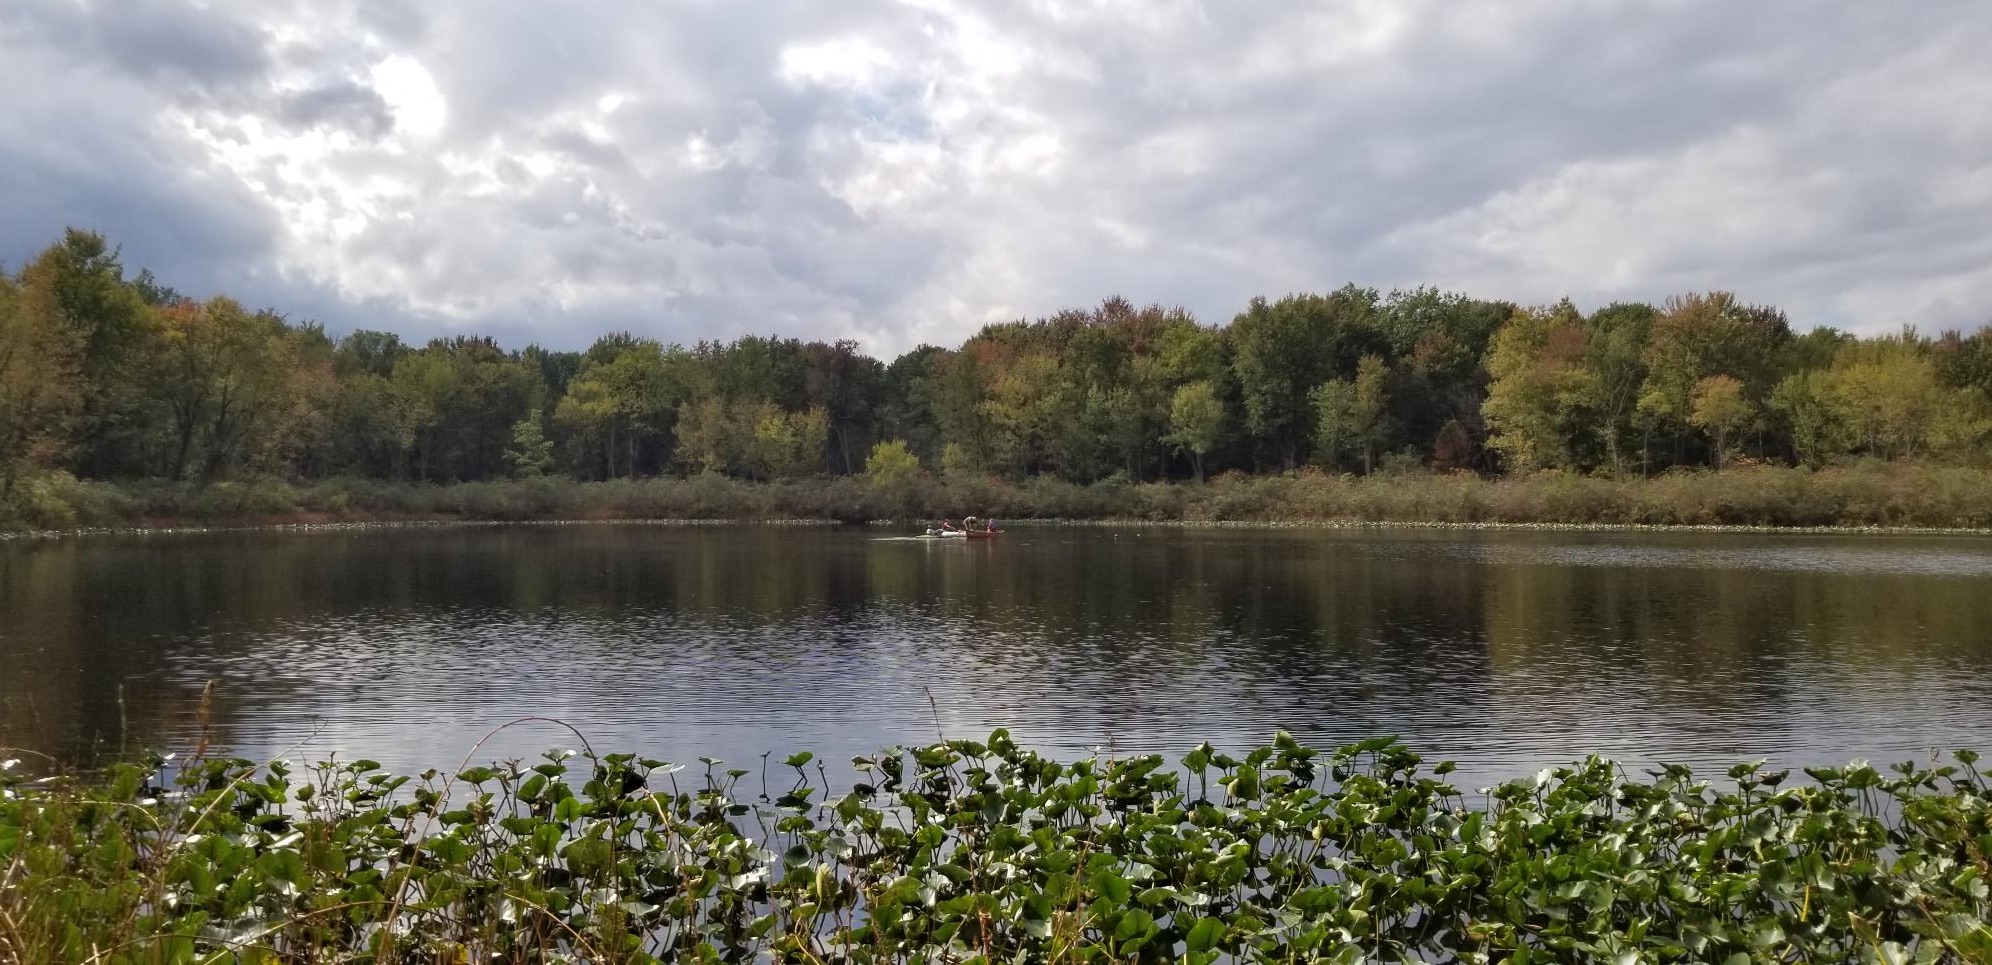 Back to Browns Lake for coring in October.
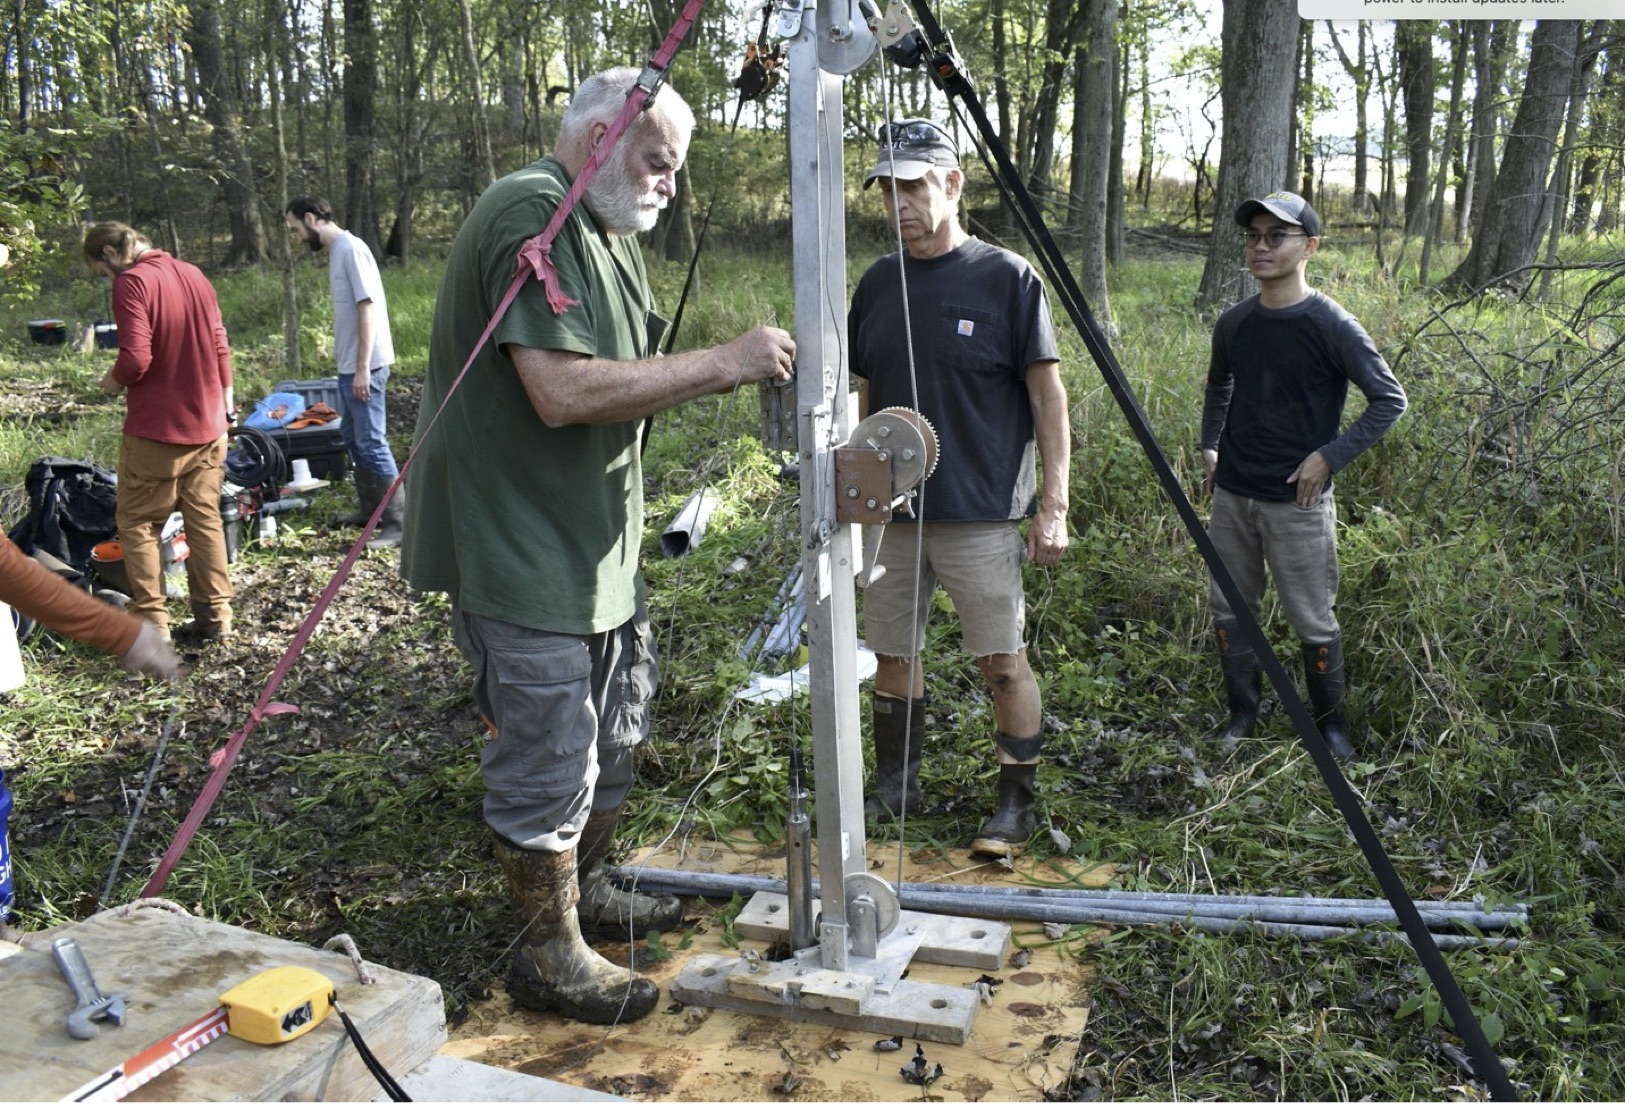 Like most of our stories of classic paleoclimate records around the world (and Ohio), there is often a hero, someone who can make it work when the call goes out to recover a continuous 10 meters of mud from a kettle. Tom Lowell at the University of Cincinnati finesses his rig as he recovers the record of the last 15,000 years of environmental change.
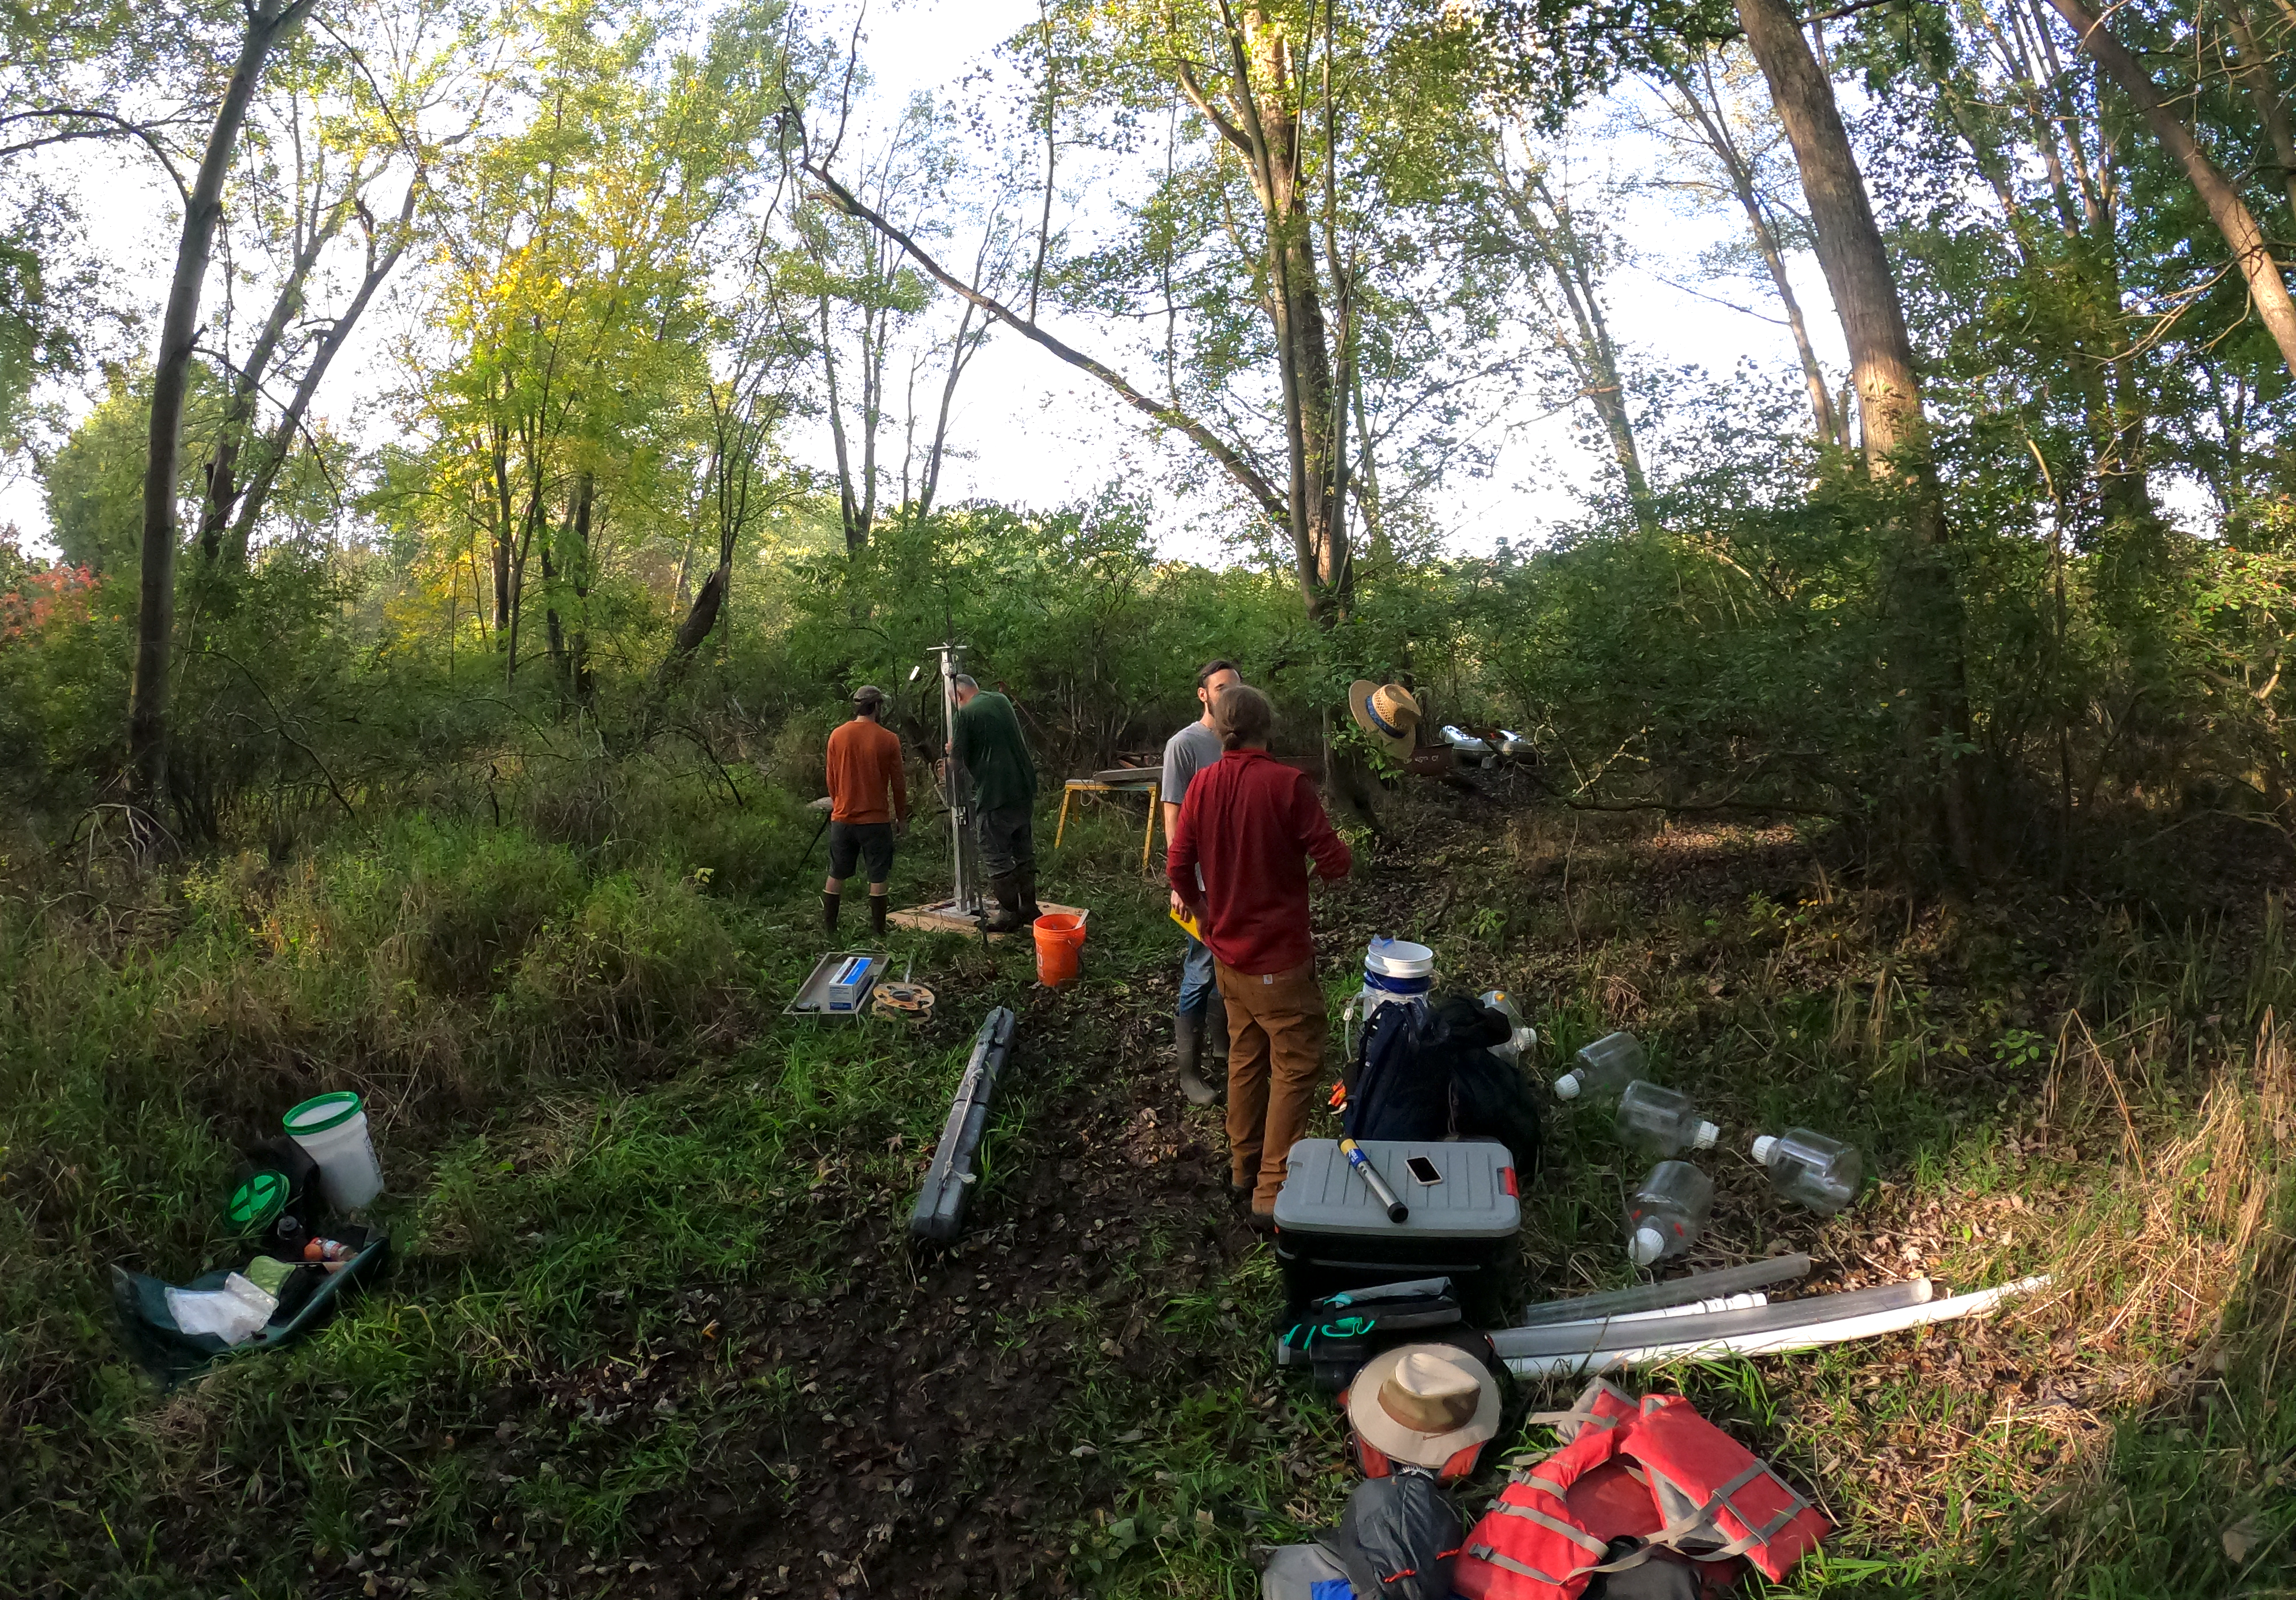 Wizards in the woods, Dr. Diefendorf setting up his lab. The UC group is ambitious in their efforts to understand the past. It involves stable isotopes of biomarkers from diatoms and other complex, but promising, ways of understanding the past changes in climate.
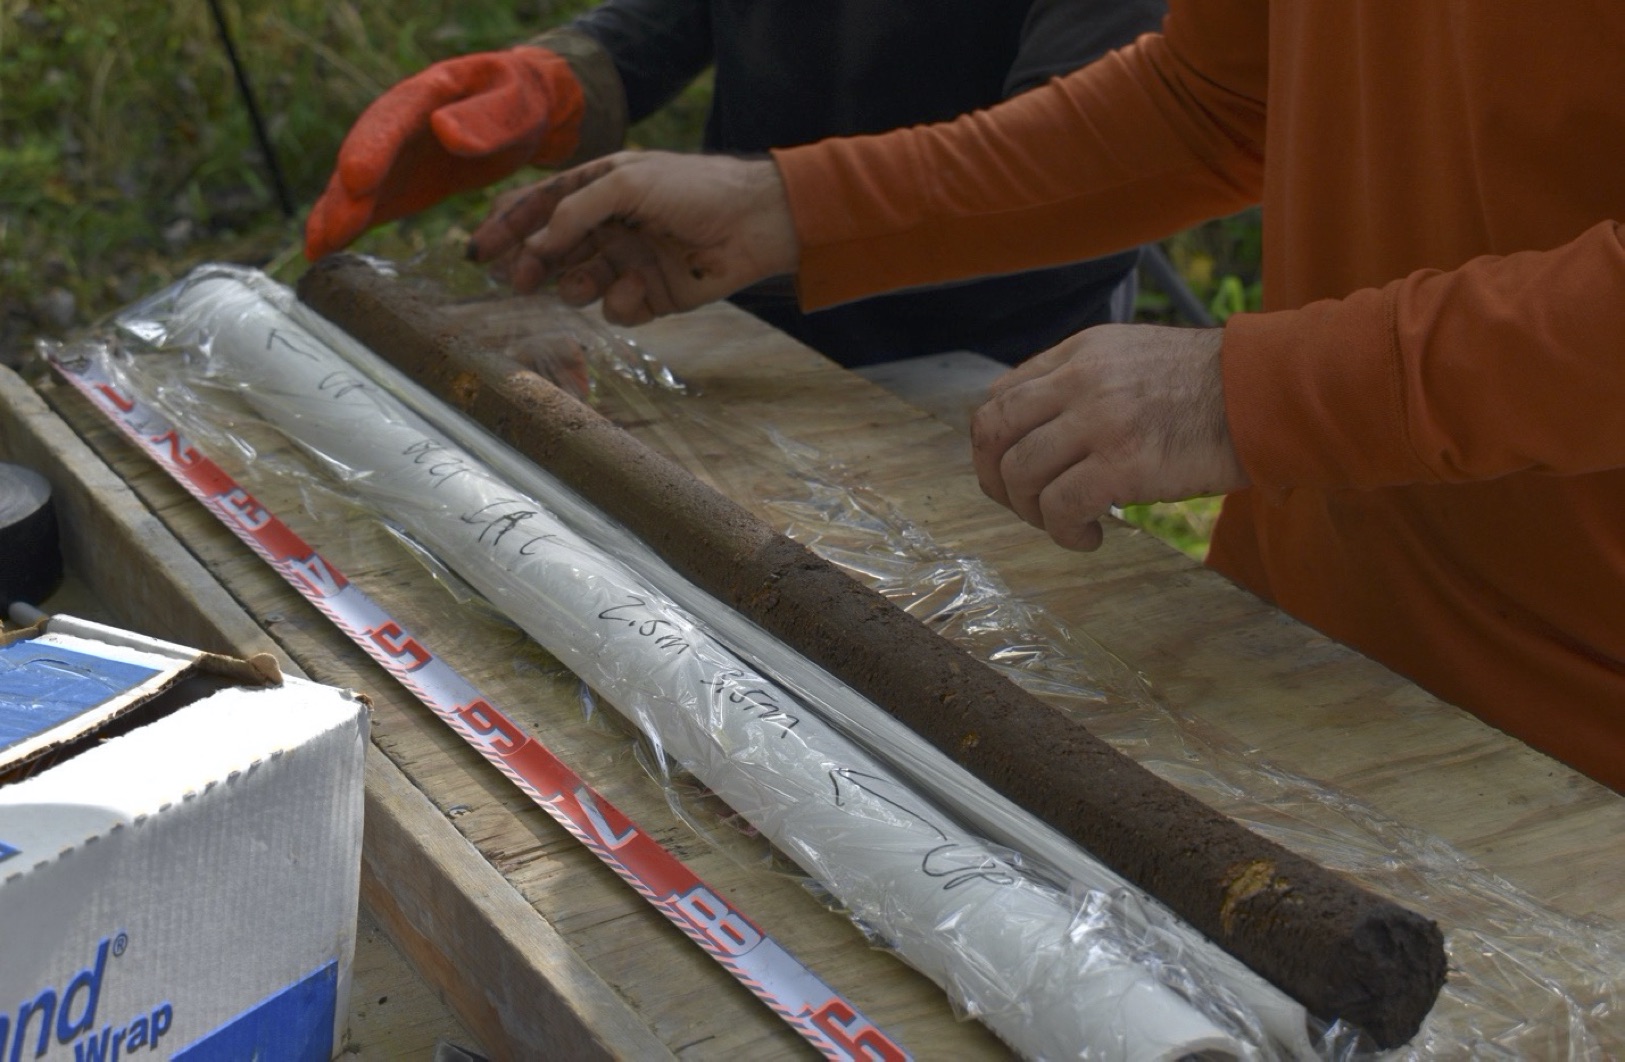 Nick and Justine wrap up the upper meter of core showing the bog (peat) /lake transition.
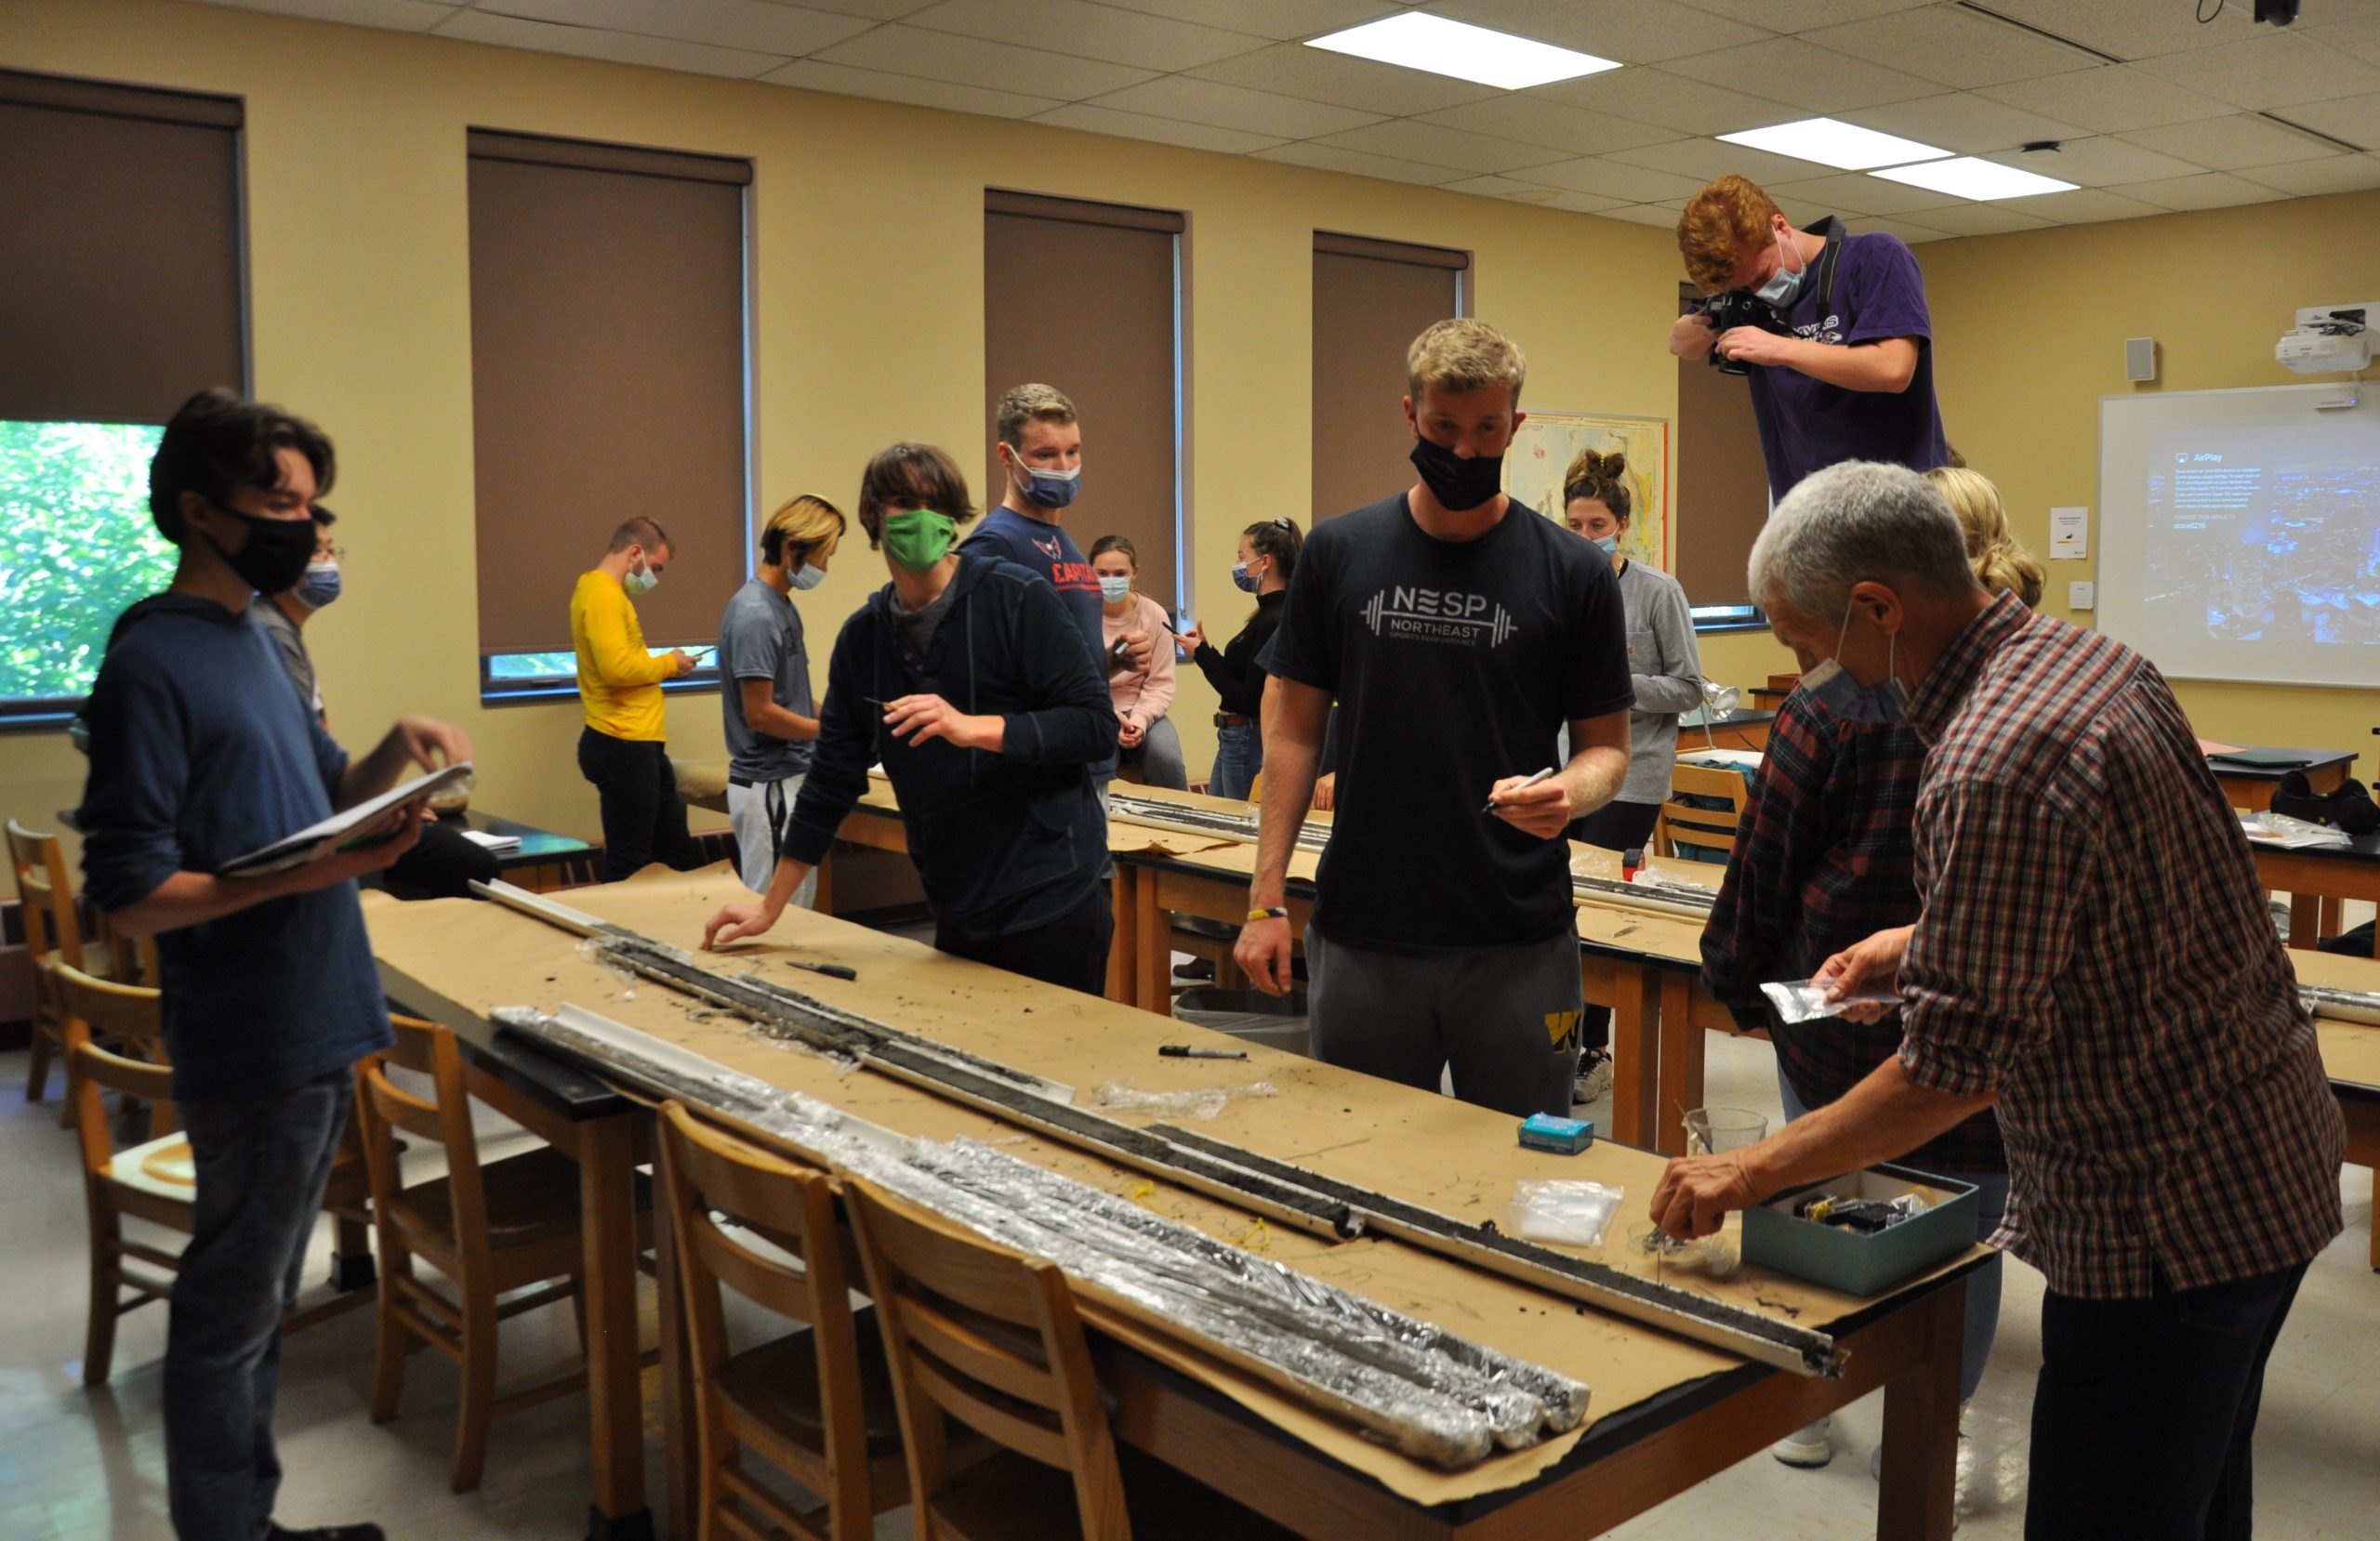 We did our best to do the core justice by dividing into three groups and examining the Bolling-Allerod transition, the 8.2 ka event and the 6 ka pluvial. The take home message is that climate has changed in the past and often abruptly – will our present ride into the greenhouse be smooth or bumpy? How bumpy? This mud truly is a time machine as were were able to pick out those transitions and confirm them (more or less) with C-14.
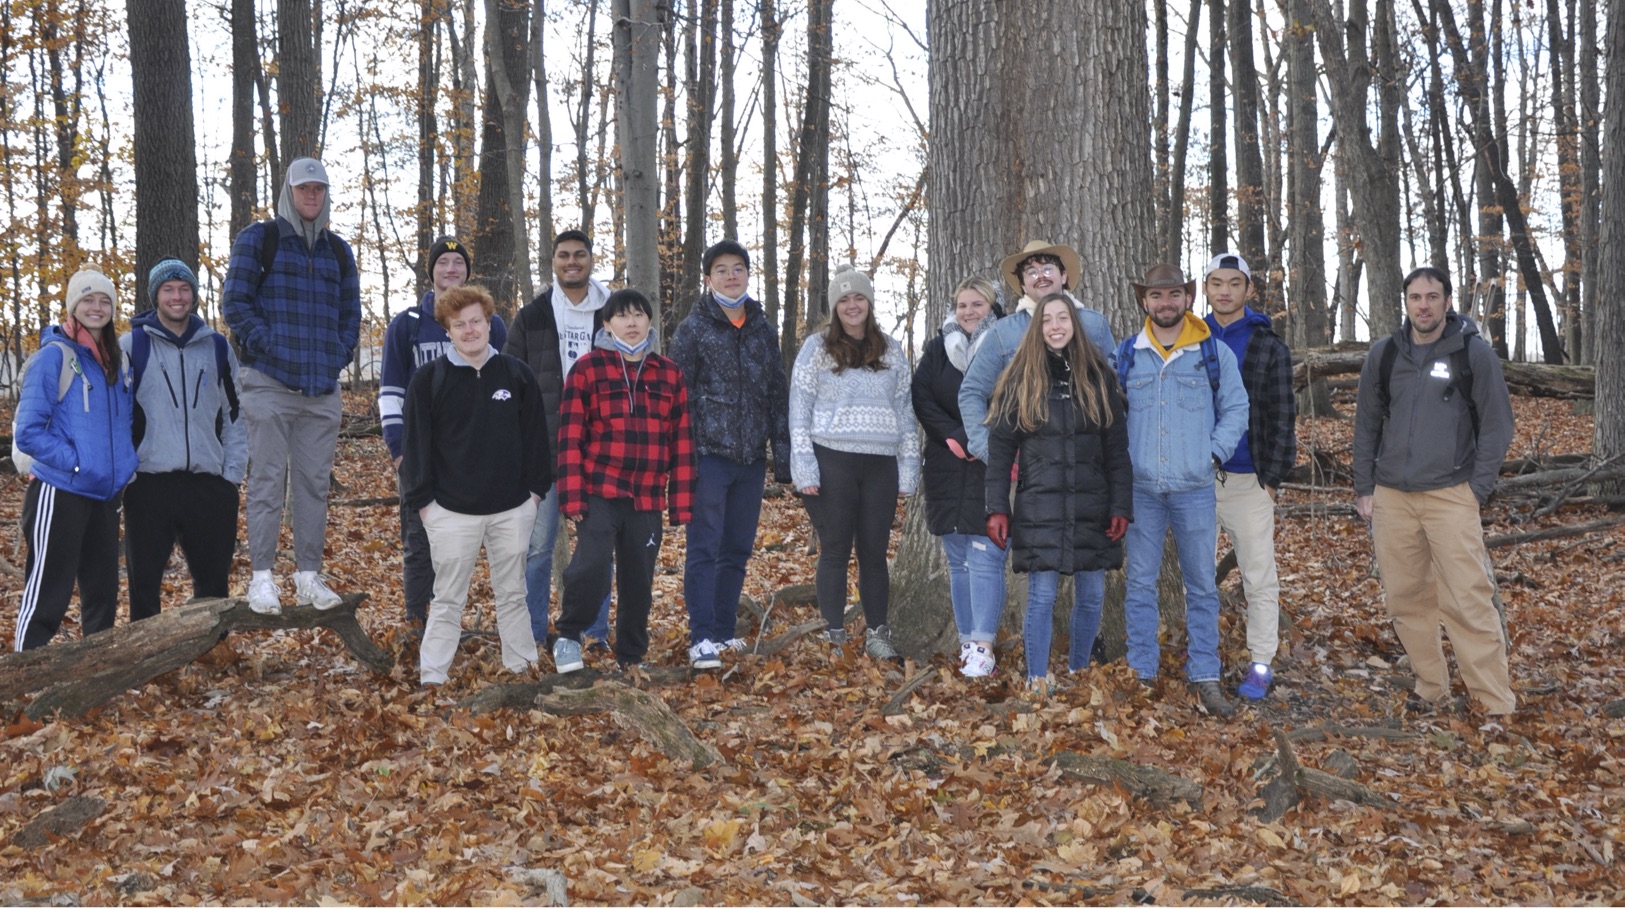 The last trip to Johnson Woods – posing in front an oak that is 350+ years old. These sentinels of change reveal alot about the past and we can still learn more from them.
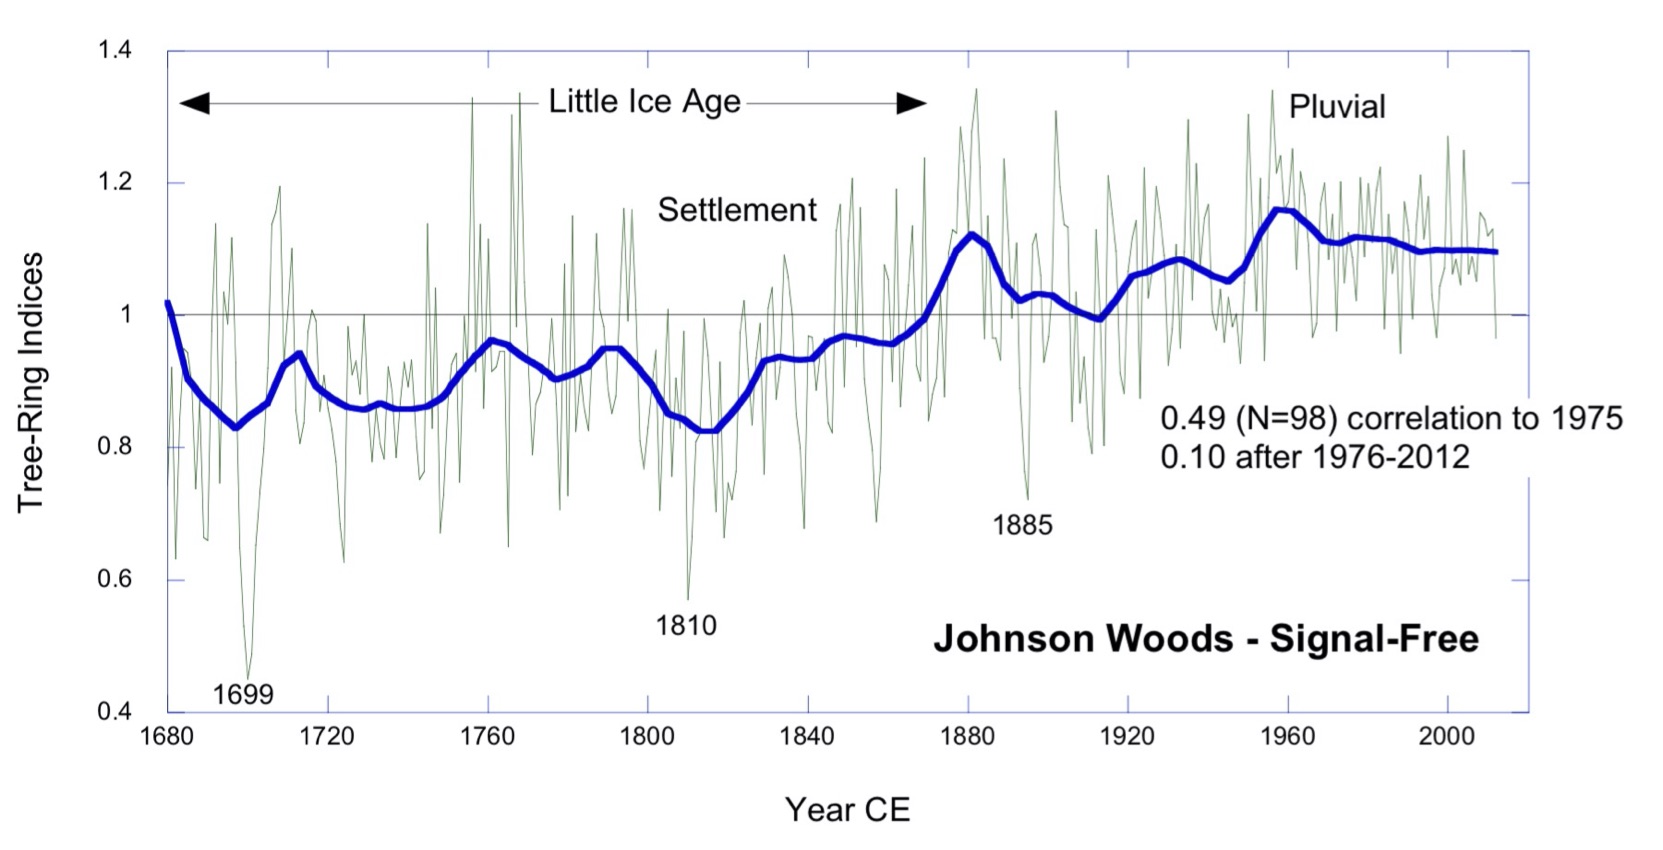 The Johnson Woods site – standardized using the signal – free software of E.R Cook. Over 100 series are in this chronology and what it shows is amazing. Major drought years of 1699 and 1810 corresponding with major volcanic events, a steady rise in growth since the time of European Settlement in the early decades of the 1800s and an inferred dry interval during that time. The increasing ring-widths continues until recent decades when the tree-ring series becomes insensitive to moisture (Maxwell et al., 2016). Prior to 1975 the correlation with summer precipitation is high (0.49, N=98 years) after from 1976-2012 the correlation drops to 0.10. It may be that the increases in temperature are now becoming more important to the trees – the correlations with temperature are negative with a strong negative June-August maximum temperature (r = -0.49; N=84) then a drop to -0.33 for 1976-2012. Intriguing also is the strengthening of the negative correlation with winter minimum temperatures (December-February, r=-0.42 (N=27 years) from 1985-2012). Perhaps due to warming night time temperatures and increased tree respiration trees can be stressed. This all needs further study.
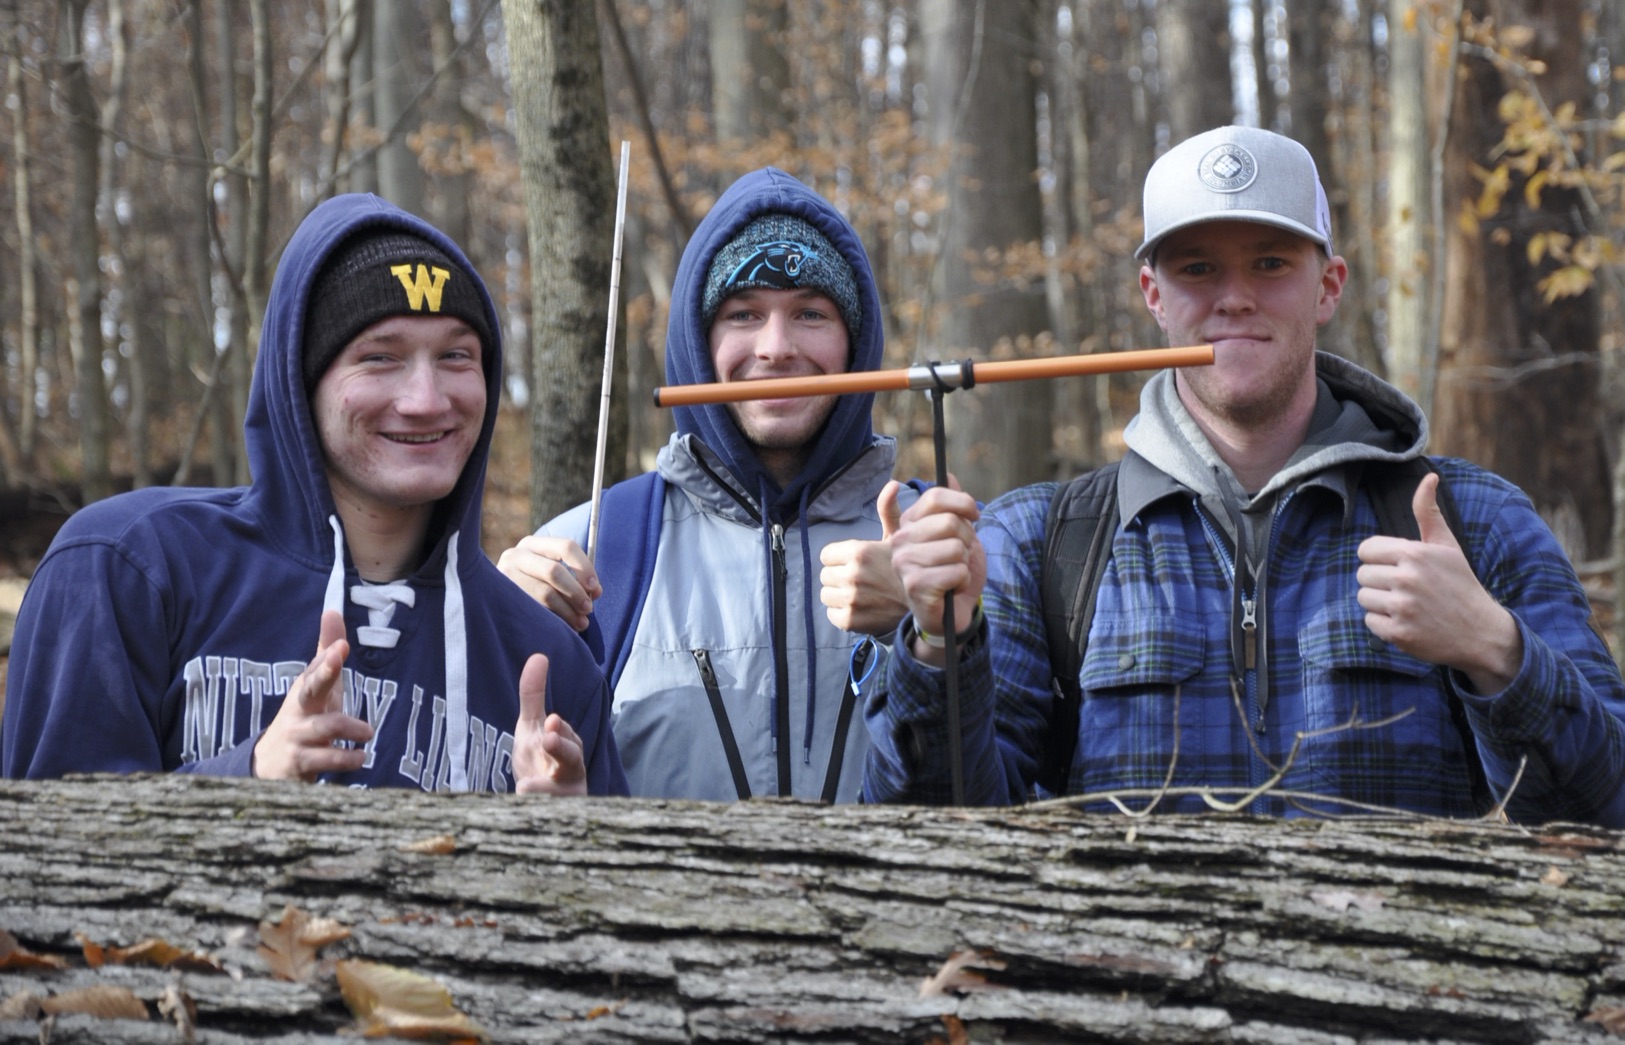 An under rated input into generating good paleoclimate data is a good attitude .